After a Big SOX Day: How Seoul, Tokyo and Taipei Chip Stocks Followed
The SOX closes in New York before Seoul, Tokyo and Taipei open, so every Asian chip stock trades on the US chip day it has just missed. We matched a year of US sessions with each market's next session to count how often 15 chip stocks, and the three main indexes, moved the same way.
The Philadelphia Semiconductor Index, or SOX, follows the 30 largest US-listed chip companies. Its regular session ends at 4:00 p.m. in New York, which in November is 6:00 a.m. in Seoul and Tokyo and 5:00 a.m. in Taipei. All three Asian markets open at 9:00 a.m. local time, so every Asian chip stock starts its day with a US chip session it did not trade through.
We wanted to know how much of that US day carries over, and whether it carries over the same way for a memory maker in Seoul, a test-equipment maker in Tokyo and a foundry in Taipei. So we counted.
How the count works
SOXQ, the Invesco PHLX Semiconductor ETF, stands in for the SOX because it tracks the index and trades as a stock. For each US session from November 20, 2025 to November 16, 2026 we took SOXQ’s move from one regular-session close to the next, and each Asian stock’s move from its previous close to the close of its next session. That Asian move includes the gap at the opening and the whole trading day, so it also carries whatever local news came out.
When an Asian market was closed for a holiday, its next session followed two or more US sessions. We left those out, which is why Seoul has 224 pairs, Tokyo 217 and Taipei 225. A pair counts as “the same way” when both moves were up or both were down. The methodology page describes how the site checks prices like these.
One number helps read the results. SOXQ rose in about 61% of these sessions, and most of the Asian stocks rose on 47% to 56% of their days. If the two had moved with no link at all, they would have matched on roughly half of the days by chance.
Fifteen chip stocks and three indexes
| Market | Stock or index | Pairs | Same way as SOXQ | After SOXQ rose 3%+: rose | Average next move | After SOXQ fell 3%+: fell | Average next move |
|---|---|---|---|---|---|---|---|
| Seoul | Samsung Electronics | 224 | 140 (62%) | 26 of 30 | +4.12% | 25 of 37 | −2.59% |
| Seoul | SK hynix | 224 | 143 (64%) | 22 of 30 | +5.01% | 24 of 37 | −3.26% |
| Seoul | Hanmi Semiconductor | 224 | 132 (59%) | 19 of 30 | +4.63% | 25 of 37 | −2.69% |
| Seoul | KOSPI | 224 | 151 (67%) | 24 of 30 | +2.98% | 25 of 37 | −2.36% |
| Tokyo | Advantest | 217 | 143 (66%) | 21 of 27 | +3.73% | 32 of 37 | −3.70% |
| Tokyo | Tokyo Electron | 217 | 137 (63%) | 20 of 27 | +3.03% | 27 of 37 | −2.78% |
| Tokyo | Kioxia | 217 | 122 (56%) | 20 of 27 | +4.57% | 25 of 37 | −4.01% |
| Tokyo | Disco | 217 | 135 (62%) | 21 of 27 | +4.04% | 30 of 37 | −3.37% |
| Tokyo | Shin-Etsu Chemical | 217 | 134 (62%) | 22 of 27 | +1.73% | 24 of 37 | −1.15% |
| Tokyo | Lasertec | 217 | 139 (64%) | 21 of 27 | +3.60% | 27 of 37 | −3.02% |
| Tokyo | Nikkei 225 | 217 | 146 (67%) | 22 of 27 | +1.48% | 29 of 37 | −1.38% |
| Taipei | TSMC | 225 | 144 (64%) | 25 of 31 | +2.00% | 29 of 36 | −1.72% |
| Taipei | MediaTek | 225 | 144 (64%) | 25 of 31 | +3.78% | 29 of 36 | −2.54% |
| Taipei | ASE Technology | 225 | 153 (68%) | 28 of 31 | +4.32% | 30 of 36 | −4.10% |
| Taipei | UMC | 225 | 134 (60%) | 22 of 31 | +2.79% | 27 of 36 | −1.81% |
| Taipei | Nanya Technology | 225 | 129 (57%) | 24 of 31 | +3.97% | 26 of 36 | −3.69% |
| Taipei | Winbond | 225 | 134 (60%) | 23 of 31 | +3.51% | 28 of 36 | −3.88% |
| Taipei | TAIEX | 225 | 163 (72%) | 29 of 31 | +1.91% | 32 of 36 | −1.81% |
“Average next move” is the average of the next-session moves after all the 3% days in that group, including the days the stock went the other way.
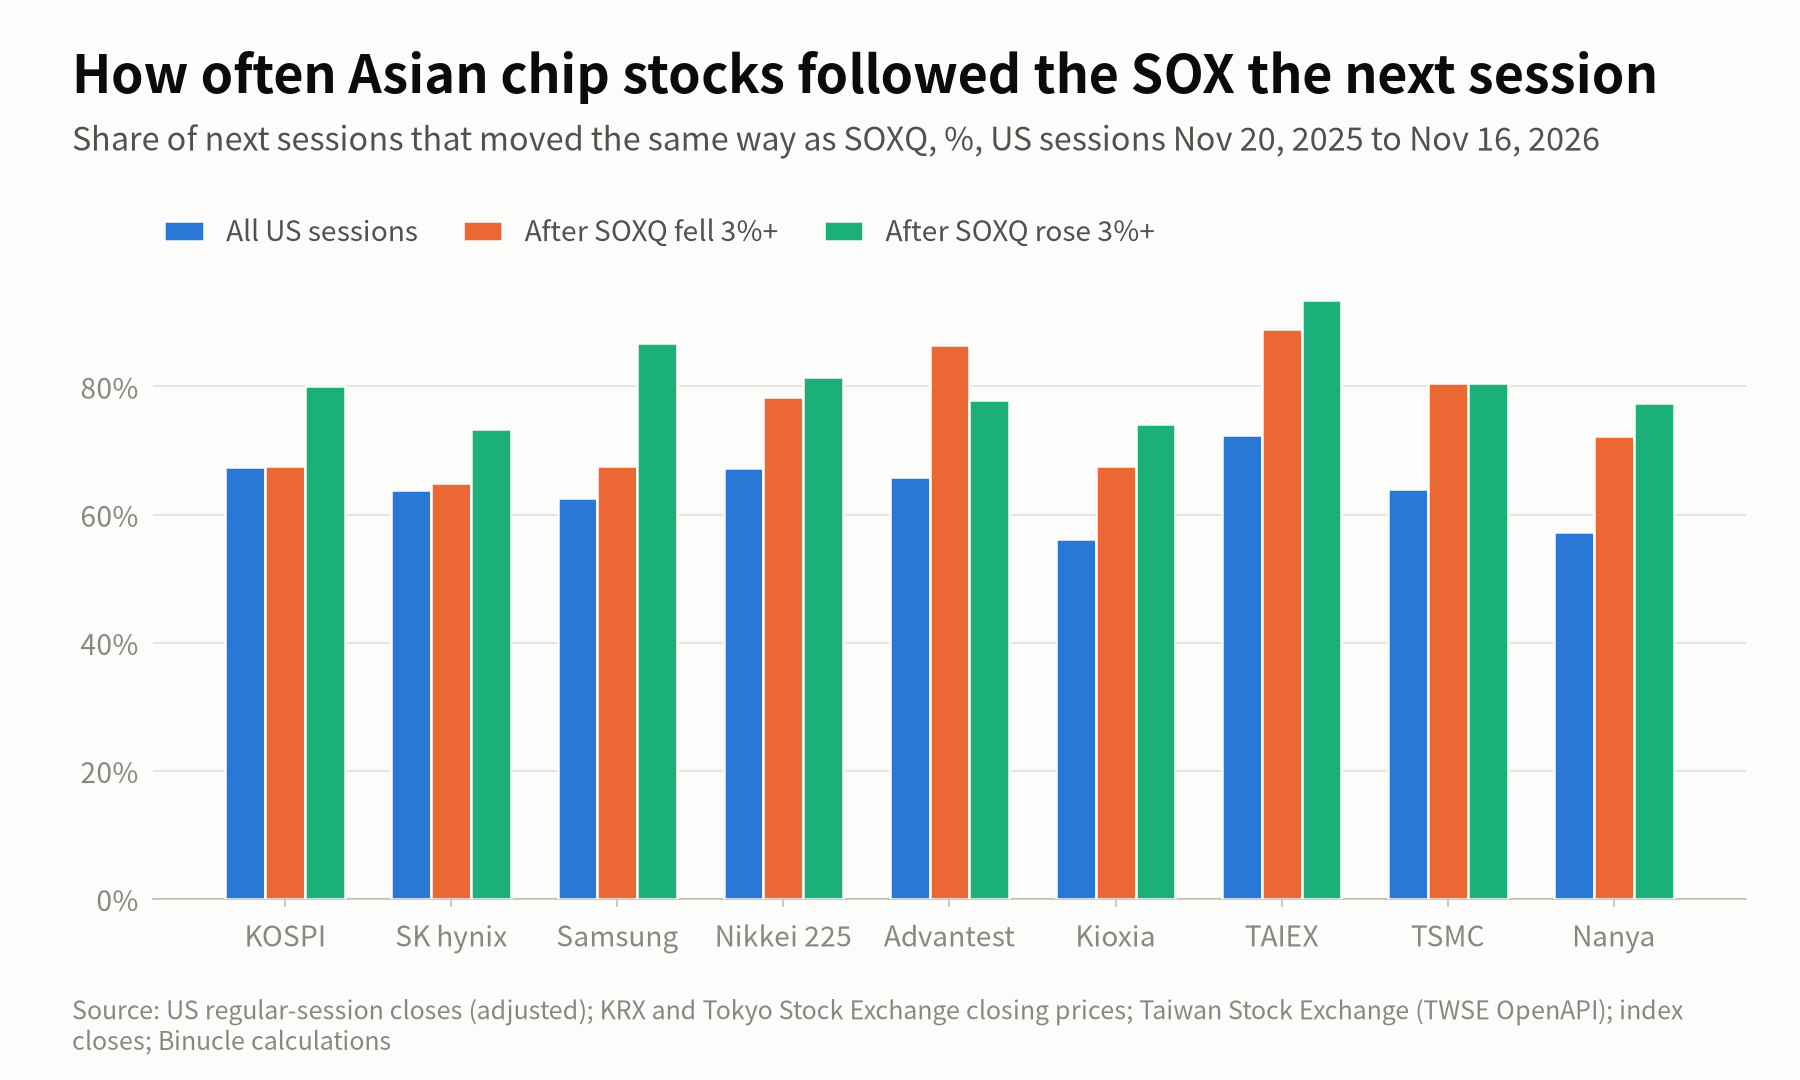
The indexes followed more often than the stocks
All three market indexes matched SOXQ more often than most of the chip stocks in them. TAIEX did so in 72% of sessions, more often than TSMC itself (64%), even though TSMC is the largest company on the Taiwan exchange. An index averages out the news of single companies: one stock can have its own reason to move against the SOX on a given day, but many stocks seldom do at once. The same holds after big days. After SOXQ rose 3% or more, TAIEX rose in 29 of 31 next sessions.
Memory makers followed least
The three stocks with the lowest share were memory makers: Kioxia in Tokyo (56%) and Nanya Technology (57%) and Winbond (60%) in Taipei. Memory chip prices move on their own cycle, and news on contract prices or a rival’s results can move these stocks in a direction the SOX did not take that night. Their moves after big SOX days were large, though: Kioxia’s average next move was −4.01% after SOXQ’s 3% falls and +4.57% after its 3% gains. Who Makes What in Memory lists what each of them sells.
Seoul after the down days
Samsung Electronics rose in the next Seoul session after 26 of the 30 days when SOXQ rose 3% or more. After the 37 days when SOXQ fell 3% or more, it fell only 25 times, and SK hynix 24 times. Tokyo’s Advantest fell after 32 of those 37.
Part of the gap comes from the year itself. KOSPI rose on 61% of the Seoul sessions in this period, and Korean chip stocks had many large up days, so they were more likely to “agree” with SOXQ on its good days than on its bad ones. A one-year count says what happened in that year; a year with a falling Korean market would likely show the opposite tilt.
The ten largest SOXQ days
| US session | SOXQ | Asian session | SK hynix | Samsung Electronics | Advantest | TSMC |
|---|---|---|---|---|---|---|
| Nov 5, 2026 | −12.13% | Nov 6 | −10.44% | −6.35% | −4.99% | −4.69% |
| Jun 5, 2026 | −10.19% | Jun 8 | −7.68% | −10.18% | −5.72% | −2.96% |
| Jul 30, 2026 | +8.12% | Jul 31 | +29.95% | +26.81% | +16.34% | +9.98% |
| Jun 11, 2026 | +7.93% | Jun 12 | +2.33% | +7.86% | +8.54% | +2.67% |
| Jun 23, 2026 | −7.83% | Jun 24 | +2.58% | +9.84% | −0.73% | −4.02% |
| Oct 30, 2026 | −7.18% | Nov 2 | +3.81% | +1.78% | +2.61% | −1.69% |
| Nov 9, 2026 | +7.03% | Nov 10 | +6.69% | +4.74% | +4.63% | +2.24% |
| Oct 22, 2026 | −6.74% | Oct 23 | +4.42% | +0.47% | −0.09% | — |
| Aug 4, 2026 | +6.53% | Aug 5 | +5.77% | +2.50% | +8.77% | +3.66% |
| Apr 8, 2026 | +6.36% | Apr 9 | −3.39% | −3.09% | −1.67% | +0.26% |
Taipei was closed on October 23 and 26, so TSMC has no single next session for October 22. The biggest SOXQ fall of the year, on November 5, reached all four stocks the next morning. Others did not: after SOXQ fell 7.83% on June 23, Samsung rose 9.84%, and after it fell 7.18% on October 30, SK hynix rose 3.81%. On July 31 KOSPI itself rose 17.91%, so the size of that day’s Korean moves reflects more than the SOX. These are single sessions, and the counts show timing, not cause.
Where this shows up on the site
The SOX map updates through US after-hours and pre-market trading, so the US chip day is visible as it forms, before Asia opens. The Chips map puts Seoul, Tokyo, Taipei and the US chip stocks on one page the next morning. For Tokyo alone, with the Nikkei 225 weights that make Advantest and Tokyo Electron matter so much, see SOX and the Nikkei 225. For how Nvidia’s results reach SK hynix and Samsung before Nvidia’s own next session, see Why Nvidia’s Earnings Move Memory Stocks, and for the opening and closing times in each city, One Chip Day, Four Closes.
Sources
Related reading
More in Explainers
- Chip Stock Heatmap Explained: How to Read the Asia-Pacific Chips MapMarket Map
- Asia Chip Stocks From a US Account: SKHY, TSM, KXIAY and Other TickersExplainers
- Who Makes What in Memory: DRAM, NAND and HBM Across Asia and the USExplainers
- Taiwan's Foreign Investor Flows: Reading TWSE's Daily Net-Buy DataExplainers
- How to Read a Japanese Kessan Tanshin (Earnings Summary)Explainers
- Advantest Explained: The Chip-Tester Maker That Moves the NikkeiExplainers
- Why US Chip Earnings Come After the Bell, and What Asia Sees NextExplainers
- Korea's 10-Day Export Data: How Chip Exports Are CountedExplainers
- TSMC's Quarterly Dividend: Ex-Dividend Dates for 2330 and TSMExplainers
- Korean Preferred Shares: Why Samsung's 005935 Trades Below Its CommonExplainers
- SOX and the Nikkei 225: How US Chip Stocks Reach Tokyo's Next SessionExplainers
- Kioxia and SanDisk: How the Two NAND Makers Share Their FabsExplainers
- Stock Split vs Reverse Split: From SOXX and SanDisk to Penny StocksExplainers
- What Is Rapidus? Japan's 2nm Chipmaker and the Companies Behind ItExplainers
- Samsung vs SK hynix: How Korea's Two Memory Giants DifferSamsung & SK hynix
- TSMC in Japan: What Is JASM, the Kumamoto Chip Plant?Explainers
- What Is HBM? High-Bandwidth Memory vs DRAM, HBM3E and HBM4Explainers
- SOXL and SOXS Explained: 3x Leveraged and Inverse Chip ETFsExplainers
- Custom AI Chips Explained: Google TPU, Amazon Trainium and ASICsExplainers
- Where Japan Fits in the Chip Supply Chain, Next to Taiwan and KoreaExplainers
- Taiwan's Chip Stocks: Who Makes WhatExplainers
- What Samsung Electronics Makes: Chips, Phones, Displays and MoreSamsung & SK hynix
- Japan's Chip Stocks: Who Makes WhatExplainers
- Why Nvidia's Earnings Move Memory StocksExplainers
- Chip Equipment Makers: ASML, Applied, Lam, KLA and Tokyo ElectronExplainers
- SOX Heatmap Explained: How to Read the US Chip Index MapMarket Map
- Memory Stock Map Explained: DRAM, NAND and HBM Makers in One ViewMarket Map
- S&P 500 Heatmap Explained: How to Read the US Market MapMarket Map
- How to Buy Japanese Chip Stocks: Tokyo Shares, OTC ADRs and ETFsGuides
- How to Buy Taiwan Stocks From Abroad: TWSE Shares, TSM and ETFsGuides
- What Do 3nm and 2nm Mean? Chip Process Nodes ExplainedExplainers
- US Chip Export Controls on China, ExplainedExplainers
- What Is CoWoS? TSMC's Advanced Packaging and the AI Chip BottleneckExplainers
- Foundry, Fabless and IDM: How Chipmakers Split the WorkExplainers
- Why Samsung Reports Earnings Twice, and How Other Chipmakers ReportSamsung & SK hynix
- SOXX vs SMH vs SOXQ: How Three Semiconductor ETFs DifferExplainers
- How a Stock Gets Into the S&P 500 and the Nasdaq-100Explainers
- US Stock Futures Overnight: What Dow, S&P 500 and Nasdaq Futures ShowExplainers
- One Chip Day, Four Closes: Seoul, Taipei, Tokyo and New YorkExplainers
- Japan's Margin Trading Data: What It Says About KioxiaExplainers
- Kioxia Outside Japan: 285A in Tokyo vs KXIAY Over the CounterExplainers
- Kioxia's 3-for-1 Split: How to Read Its Price HistoryExplainers
- Micron's Fiscal Calendar: Why Its Quarters Don't Match Samsung'sExplainers
- Nikkei 225 vs TOPIX: Why Chip Stocks Move Them So DifferentlyExplainers
- The Philadelphia Semiconductor Index (SOX) and Why Asia Watches ItExplainers
- Taiwan's 10% Daily Price Limit and Other Rules for Foreign InvestorsExplainers
- TSM vs 2330: Why TSMC's US Shares Trade Above TaipeiExplainers
- TSMC's Monthly Sales: How Taiwan's Monthly Revenue Reports WorkExplainers
- Why One Stock Moves Taiwan's Market: TSMC and the TAIEXExplainers
- How Foreign Investors Move the KOSPI, and Where to See the Daily DataExplainers
- How to Buy Korean Stocks in 2026: 4 Routes for US, Singapore, UKGuides
- How to Buy Samsung Stock Outside Korea: Shares, London GDR and ETFsGuides
- Korea Discount and the Value-up Program, Explained SimplyExplainers
- KOSPI Heatmap Explained: How to Read Korea's Market MapMarket Map
- Why MSCI Still Hasn't Upgraded Korea, and What Would Change ItExplainers
- How Samsung and SK hynix Compare in HBMSamsung & SK hynix
- SKHY vs 000660: How the Two Ways to Own SK hynix DifferSamsung & SK hynix
- Why Is the KOSPI So Volatile? Chips, Foreign Money and the WonExplainers