How Foreign Investors Move the KOSPI, and Where to See the Daily Data
They own close to half of Samsung Electronics and SK hynix, but their selling does not always push the index down. What the daily numbers show, and where to find them.
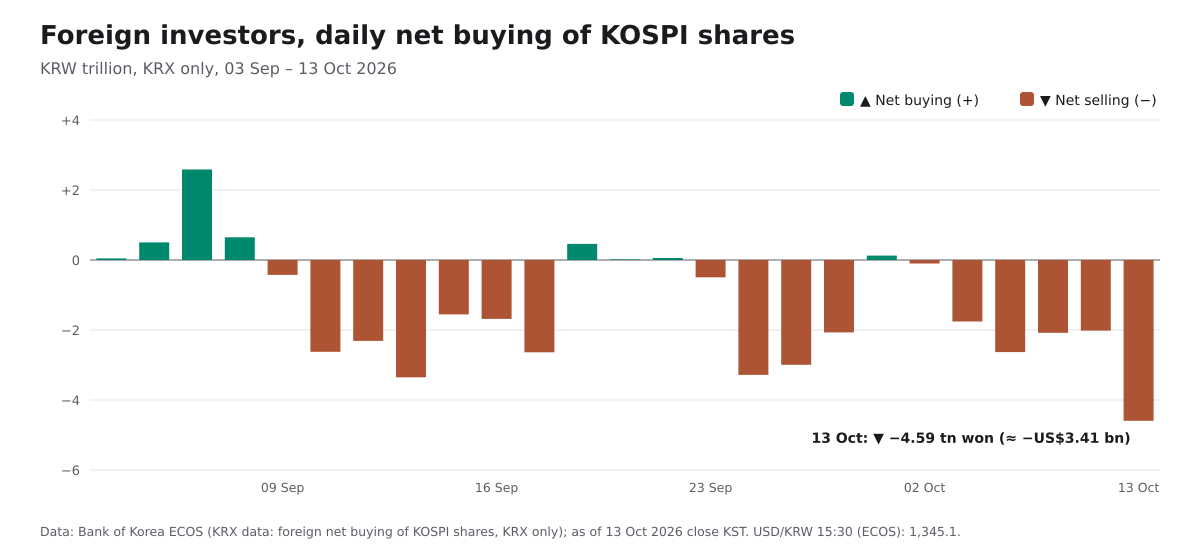
Foreign investors move the KOSPI mainly through size. They own close to half of Samsung Electronics and SK hynix, the two largest companies on the market, and they make up a large part of each day’s trading. On October 13, 2026 foreign investors sold a net 4.59 trillion won (about US$3.41 billion) of KOSPI shares, and the index fell 5.46% to 6,035.35. But the link between foreign selling and the index is not one to one, and the daily numbers are free to check. This guide shows how to read them.
Won amounts for a single day are converted at that day’s won-dollar rate at the 15:30 Korea time close: 1,345.1 won per dollar on October 13 (Bank of Korea, ECOS). Totals over several days are converted day by day at each day’s closing rate.
The foreign investor figures are the Korea Exchange’s (KRX) own daily totals for KOSPI shares, as published by the Bank of Korea in its ECOS database. They cover trading on KRX only. Nextrade, Korea’s alternative trading venue, is not included, so figures that combine the two venues can be larger.
Who counts as a “foreign investor” in Korean market data?
The Korea Exchange (KRX) sorts every trade by the type of investor behind it. The main groups are:
- Individuals: retail investors living in Korea.
- Foreign investors: investors based outside Korea, from global funds to overseas retail investors.
- Institutions: brokers, insurers, investment trusts, private equity funds, banks, pension funds and other financial firms.
- Other corporations: mostly non-financial companies.
The key number is net buying: the value a group bought minus the value it sold. When foreign investors are “net sellers”, they sold more than they bought that day.
One rule makes the data easier to read. Every share sold has a buyer, so the net figures of all groups add up to zero: when foreign investors are net sellers, individuals, institutions and companies together are net buyers of the same amount. On October 13 foreign investors sold a net 4.59 trillion won, their largest daily net sale in the five weeks shown here:
How much of the KOSPI do foreign investors own?
For the two biggest companies, the answer is close to half. On October 13, foreign investors held 46.18% of Samsung Electronics’ common shares (about 2.70 billion shares) and 49.12% of SK hynix. Both were a little lower than on October 8 (46.35% and 49.52%).
The two big names matter because of their weight. On October 13, Samsung Electronics and SK hynix together made up 52.4% of the market value of the KOSPI 200, the index of Korea’s 200 largest stocks. When foreign investors sell those two stocks heavily, the index feels it. On October 13 the two stocks closed down 7.39% and 10.09%. Our KOSPI heatmap guide shows how much of the index those two boxes cover.
Does foreign selling always push the KOSPI down?
No. Foreign investors were net sellers in every month from May to September, and they kept selling in October. Yet the index first rose by more than half, then fell back:
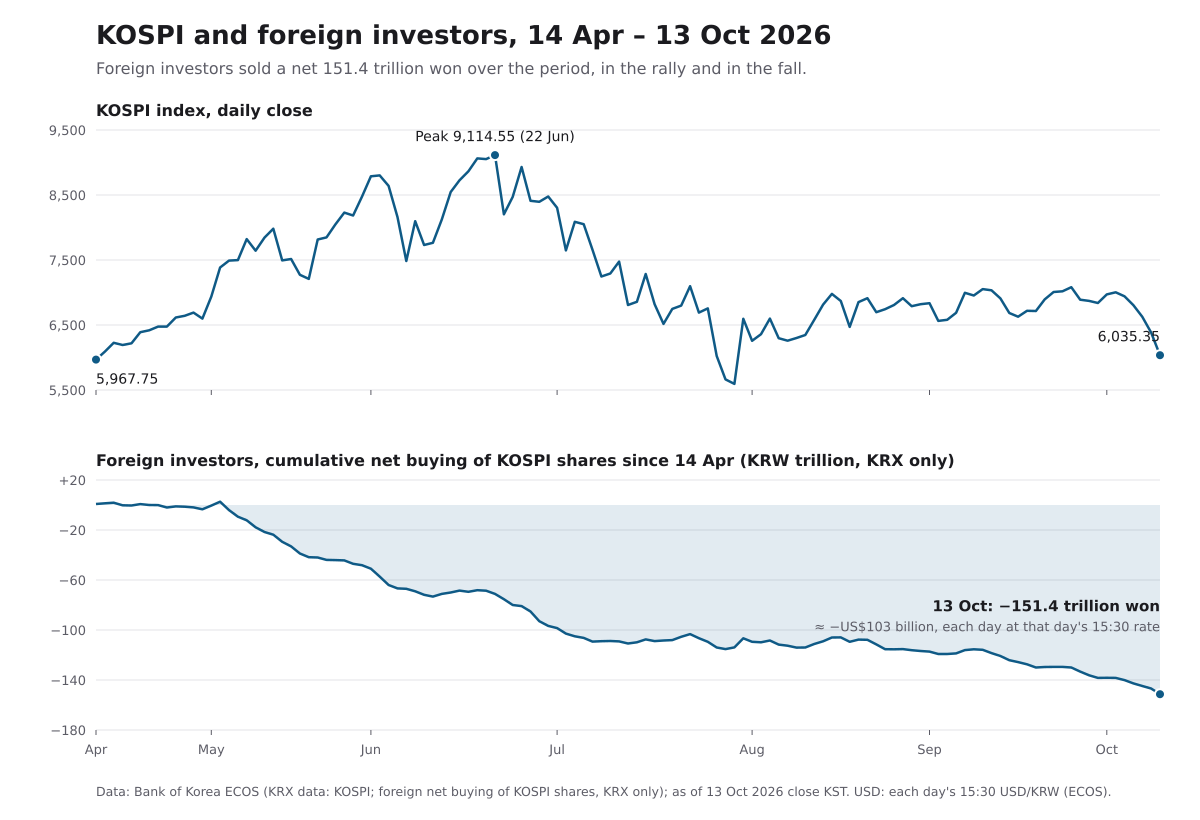
- April 14 to June 22: the KOSPI rose 52.7%, from 5,967.75 to 9,114.55. Over the same days, foreign investors sold a net 71.1 trillion won.
- June 23 to October 13: foreign investors sold another 80.3 trillion won, and the index ended 33.8% below its June peak.
Single days show the same thing. The biggest day of foreign net selling in the period was June 29, at 7.76 trillion won, and the KOSPI moved just 0.20% lower. On May 7 foreign investors sold a net 6.72 trillion won and the index rose 1.43%.
So foreign flows are one force among several. Someone is always on the other side of the trade, and what happens to prices depends on who that is and how eager they are. The data shows what happened. It does not show what comes next.
What happened on October 12 and 13?
- October 12: the KOSPI fell 3.65% to 6,384.24. Foreign investors sold a net 2.02 trillion won (about US$1.51 billion).
- October 13: the KOSPI fell 5.46% to 6,035.35. Foreign investors sold a net 4.59 trillion won (about US$3.41 billion). Total KOSPI trading on the Korea Exchange that day was about 28.45 trillion won.
Over the five sessions from October 6 to 13, foreign investors sold a net 13.08 trillion won (about US$9.75 billion), and the index fell 13.8% from its October 2 close of 7,003.74. The market was closed for public holidays on October 5 and 9.
The flow data says who sold. It does not say why.
How does the won exchange rate fit in?
When a foreign investor sells Korean shares, the proceeds are in won. Taking that money home means selling won for dollars or other currencies. Large, steady outflows can therefore weaken the won, and inflows can strengthen it. It also works the other way: a weaker won lowers the dollar value of Korean holdings, which can itself lead some funds to sell.
The 2026 numbers show that the link is loose. These are the Bank of Korea’s won-dollar rates at the 15:30 Korea time close, the same moment as the index close:
- April 14: 1,481.2 won per dollar
- July 1: 1,554.9, a weaker won during the heaviest foreign selling
- August 31: 1,368.6, so a dollar bought 12.0% fewer won than on July 1, even though foreign investors kept selling
- October 12: 1,335.1
- October 13: 1,345.1, a slightly weaker won (0.75%) on the day of the big sell-off
For an investor outside Korea, the currency is part of the return. From April 14 to October 13 the KOSPI rose 1.13% in won. Measured in US dollars, the same index level rose about 11.4%, because the dollar bought 9.2% fewer won at the end of the period. This is an index-level example, not the return of any fund.
Where can you see the daily foreign investor data?
KRX Data Marketplace (data.krx.co.kr) is the official source. It publishes daily trading by investor type for the KOSPI and for each stock, and foreign ownership by stock. According to the Korean news site Global Economic, KRX has required users to log in since December 27, 2025, but the data itself is still free to view.
The Bank of Korea’s ECOS database (ecos.bok.or.kr) republishes the KRX daily figure for foreign investors’ net buying of KOSPI shares, in its stock market table (802Y001), in English as well as Korean. This guide uses that series.
Broker apps also show investor trends. Some add Nextrade trading to KRX, so their totals can be larger than the KRX figures. Check which venues an app counts before comparing numbers.
Timing from abroad:
- Singapore: Korea is one hour ahead. The regular session runs from 09:00 to 15:30 Korea time, which is 08:00 to 14:30 in Singapore. KRX’s figures for the day appear after the close.
- US East Coast: the close at 15:30 Korea time is 02:30 in New York during daylight saving time, so the day’s data is ready by the US morning.
How to read the numbers
- Look at value in won, not share counts, when comparing days or stocks.
- Compare a day’s net selling with total trading that day. Five trillion won means more on a quiet day than on a busy one.
- Add up several days. Single days are noisy, as June 29 and May 7 show.
- Check Samsung Electronics and SK hynix separately. Together they are about half of the KOSPI 200, so their flows often explain the headline number.
- Remember the zero-sum rule: foreign selling is always someone else’s buying.
Sources
See today’s Korea market map →
Related reading
More in Explainers
- Chip Stock Heatmap Explained: How to Read the Asia-Pacific Chips MapMarket Map
- Asia Chip Stocks From a US Account: SKHY, TSM, KXIAY and Other TickersExplainers
- Who Makes What in Memory: DRAM, NAND and HBM Across Asia and the USExplainers
- How to Buy Japanese Chip Stocks: Tokyo Shares, OTC ADRs and ETFsGuides
- How to Buy Taiwan Stocks From Abroad: TWSE Shares, TSM and ETFsGuides
- What Do 3nm and 2nm Mean? Chip Process Nodes ExplainedExplainers
- US Chip Export Controls on China, ExplainedExplainers
- What Is CoWoS? TSMC's Advanced Packaging and the AI Chip BottleneckExplainers
- Foundry, Fabless and IDM: How Chipmakers Split the WorkExplainers
- Why Samsung Reports Earnings Twice, and How Other Chipmakers ReportExplainers
- SOXX vs SMH vs SOXQ: How Three Semiconductor ETFs DifferExplainers
- How a Stock Gets Into the S&P 500 and the Nasdaq-100Explainers
- Dow, S&P 500 and Nasdaq: What Each US Stock Index MeasuresExplainers
- US Stock Futures Overnight: What Dow, S&P 500 and Nasdaq Futures ShowExplainers
- One Chip Day, Four Closes: Seoul, Taipei, Tokyo and New YorkExplainers
- Japan's Margin Trading Data: What It Says About KioxiaExplainers
- Kioxia Outside Japan: 285A in Tokyo vs KXIAY Over the CounterExplainers
- Kioxia's 3-for-1 Split: How to Read Its Price HistoryExplainers
- Micron's Fiscal Calendar: Why Its Quarters Don't Match Samsung'sExplainers
- Nikkei 225 vs TOPIX: Why Chip Stocks Move Them So DifferentlyExplainers
- The Philadelphia Semiconductor Index (SOX) and Why Asia Watches ItExplainers
- Taiwan's 10% Daily Price Limit and Other Rules for Foreign InvestorsExplainers
- TSM vs 2330: Why TSMC's US Shares Trade Above TaipeiExplainers
- TSMC's Monthly Sales: How Taiwan's Monthly Revenue Reports WorkExplainers
- Why One Stock Moves Taiwan's Market: TSMC and the TAIEXExplainers
- How to Buy Korean Stocks in 2026: 4 Routes for US, Singapore, UKGuides
- How to Buy Samsung Stock Outside Korea: Shares, London GDR and ETFsGuides
- Korea Discount and the Value-up Program, Explained SimplyExplainers
- KOSPI Heatmap Explained: How to Read Korea's Market MapMarket Map
- Why MSCI Still Hasn't Upgraded Korea, and What Would Change ItExplainers
- How Samsung and SK hynix Compare in HBMSamsung & SK hynix
- SKHY vs 000660: How the Two Ways to Own SK hynix DifferSamsung & SK hynix
- Why Is the KOSPI So Volatile? Chips, Foreign Money and the WonExplainers