Dow, S&P 500 and Nasdaq: What Each US Stock Index Measures
Three numbers sum up the US session that ends before dawn in Asia, and they often disagree. Each one picks different companies and weighs them a different way. Here is how each is built, where Nvidia, Micron, TSMC and SK hynix fit, and how far apart the three moved in 2026.
“Stocks rose overnight in New York” can mean three different things. The Dow Jones Industrial Average, the S&P 500 and the Nasdaq are all ways of turning thousands of US share prices into one number, and on many days they do not agree. They differ in two simple ways: which companies they include, and how much say each company gets. Once those two choices are clear, most of the gaps between them make sense.
Index levels below are official closes from S&P Dow Jones Indices (the Dow and the S&P 500) and Nasdaq (the Nasdaq Composite, the Nasdaq-100 and the SOX).
The three side by side
| Dow | S&P 500 | Nasdaq Composite | Nasdaq-100 | |
|---|---|---|---|---|
| Members | 30 stocks | 500 companies (503 share lines on Sept 30, 2026) | Every eligible Nasdaq listing (3,396 on Sept 30, 2026) | 100 largest non-financial Nasdaq listings |
| Weighted by | Share price | Market value of shares the public can trade | Market value | Market value, with caps |
| Chosen by | A committee, without fixed rules | A committee, with rules | Rules only | Rules only |
| Started | May 26, 1896 | March 4, 1957 | February 5, 1971 | January 31, 1985 |
Each column is explained below.
The Dow: 30 stocks, weighted by price
The Dow is the oldest of the three. S&P Dow Jones Indices, which runs it, dates it to May 26, 1896, when it held 12 industrial companies. Today it holds 30 stocks that the methodology describes as “some of the largest U.S. companies.”
There is no formula for getting in. An Averages Committee of three people from S&P Dow Jones Indices and two from The Wall Street Journal picks the members, and the methodology says “stock selection is not governed by quantitative rules.” The committee chooses from companies in the S&P 500 that are incorporated and headquartered in the US, leaving out transportation and utility companies, which have Dow averages of their own.
What makes the Dow unusual is that it is price-weighted. The index adds up the share prices of its 30 members and divides by a number called the divisor. Company size plays no part. Two things follow:
- A $1 move in any member moves the Dow by the same number of points, whether that company is worth $100 billion or $4 trillion.
- A stock that trades at $400 a share carries four times the weight of one at $100, even if the cheaper stock belongs to the larger company.
The divisor is adjusted when a member splits its shares or is replaced, so the index level does not jump just because of the change. This is also why a stock split lowers a company’s weight in the Dow: the share price falls, and the company’s size stays the same.
Membership changes are rare and are announced by S&P Dow Jones Indices. Nvidia replaced Intel before the open on November 8, 2024; the index provider said the change gave the Dow “a more representative exposure to the semiconductors industry.” Alphabet replaced Verizon before the open on June 29, 2026. On State Street’s list of the 30 stocks held by its Dow fund (DIA) on October 22, 2026, Nvidia is the only chipmaker, and there is no memory maker.
The S&P 500: about 500 companies, weighted by size
The S&P 500 was launched on March 4, 1957. It is meant to hold 500 companies; on September 30, 2026, it had 503 lines because a few companies are included with more than one class of share.
Its weighting is the one most people would expect. Each company counts in proportion to its float-adjusted market value: the share price times the number of shares that public investors can actually trade, leaving out large blocks held by founders, governments or parent companies. A company worth ten times as much carries about ten times the weight.
An Index Committee decides who joins, but candidates must first pass rules set out in the methodology. Among them:
- the company must be domiciled in the US;
- its total market value must be at least US$22.7 billion (the level set on July 1, 2025; S&P reviews it every quarter);
- at least 10% of its shares must be available to public investors, and they must trade often enough;
- its GAAP net income must be positive for the latest quarter and for the latest four quarters added together.
The methodology also lists American depositary receipts (ADRs) as ineligible. That rule, together with the US-domicile rule, keeps out Asian companies whose shares trade in New York as receipts, TSMC included.
Because of the size weighting, a handful of large companies now carry much of the index. S&P’s factsheet for September 30, 2026, shows the largest member at 8.4% of the index and the ten largest together at 39.1%. The Information Technology sector, which includes the chipmakers, was 39.7%. Micron was among the ten largest members that day. Other chip companies in the index include Nvidia, Broadcom, AMD and Intel, and SanDisk, which joined effective November 28, 2025.
“The Nasdaq”: an exchange and two indexes
Nasdaq is first of all a stock exchange, where companies list their shares. The same company also runs indexes built from those listings, and “the Nasdaq” in a market report can mean either of two:
The Nasdaq Composite includes, in the methodology’s words, “all domestic and international common type stocks listed on the Nasdaq Stock Market.” ADRs count, as long as the security is listed only on Nasdaq. Members are weighted by market value, and the list changes daily as companies list and delist. There were 3,396 members on September 30, 2026. Nasdaq dates the index to February 5, 1971, when it started at a base of 100.
The Nasdaq-100 takes the 100 largest non-financial companies listed on Nasdaq, so banks and insurers are left out. It started on January 31, 1985. Members are weighted by market value, but with caps so that a few giants cannot take over the index. Under the 2026 methodology:
- if any company passes 24% of the index, it is cut back to 20%;
- if the companies above 4.5% add up to 48% or more, that group is cut back to 40%;
- one security may not pass 14%, and the five largest together may not pass 38.5%.
The list is rebuilt once a year, taking effect after the third Friday in December. A new listing normally has to trade on Nasdaq for three full calendar months first. ADRs are allowed; for a company whose main listing is in another country, only the value of the receipts listed on Nasdaq counts.
Neither Nasdaq index is a technology index by rule. They lean toward technology because so many large technology companies list on Nasdaq. In the Composite’s factsheet for September 30, 2026, Nvidia was the largest member at 11.68%, followed by Apple at 10.31% and Microsoft at 8.08%. Nasdaq’s Nasdaq-100 list for October 22, 2026, includes Nvidia, Broadcom, AMD, Micron, SanDisk and ASML among the chip companies.
Where do the Asian chipmakers fit?
Mostly outside all three. Each index draws only from US companies or from shares listed on a particular exchange, and the big Asian memory and foundry companies trade in Seoul, Taipei and Tokyo.
| Company | What trades in the US | Dow | S&P 500 | Nasdaq-100 | SOX |
|---|---|---|---|---|---|
| TSMC | ADSs on the NYSE (TSM) | No | No | No | Yes |
| SK hynix | ADSs on Nasdaq (SKHY) since July 10, 2026 | No | No | No | No |
| Samsung Electronics | No US listing | No | No | No | No |
| Kioxia | Over-the-counter receipt (KXIAY) | No | No | No | No |
| Micron | Shares on Nasdaq (MU) | No | Yes | Yes | Yes |
| SanDisk | Shares on Nasdaq (SNDK) | No | Yes | Yes | No |
| Nvidia | Shares on Nasdaq (NVDA) | Yes | Yes | Yes | Yes |
TSMC is the clearest case. Its US-traded ADSs are listed on the New York Stock Exchange, so they cannot be in the Nasdaq indexes, and the S&P 500 does not take ADRs. SK hynix’s ADSs, each worth one-tenth of a common share according to its prospectus, list on Nasdaq but were not on Nasdaq’s Nasdaq-100 list of October 22. The SOX column comes from Nasdaq’s list of October 19; it is the US index where TSMC does appear, and our SOX explainer covers how it is built. For what each US-traded ticker represents, see Asia Chip Stocks From a US Account.
Why points can mislead
Market reports often give the Dow’s move in points: “the Dow added 500 points.” Points only mean something next to the index level, and the levels are very different. The Dow closed at 52,856.09 on October 21, 2026; the S&P 500 closed at 7,757.17.
Two days in October show the problem:
| Session | Dow | S&P 500 | Nasdaq Composite | Nasdaq-100 |
|---|---|---|---|---|
| Wed, Oct 14 | −48.62 pts (−0.09%) | −86.51 pts (−1.11%) | −511.51 pts (−1.88%) | −618.66 pts (−2.02%) |
| Tue, Oct 20 | +529.85 pts (+1.02%) | +21.84 pts (+0.28%) | −6.07 pts (−0.02%) | −39.06 pts (−0.13%) |
On October 14 the S&P 500 lost more points than the Dow, even though the Dow is almost seven times higher. On October 20 the Dow gained more than 500 points while both Nasdaq indexes slipped. Percentages compare the indexes fairly; points do not.
How far apart do they move?
The chart puts four indexes on one scale, with April 1, 2026, set to 100.
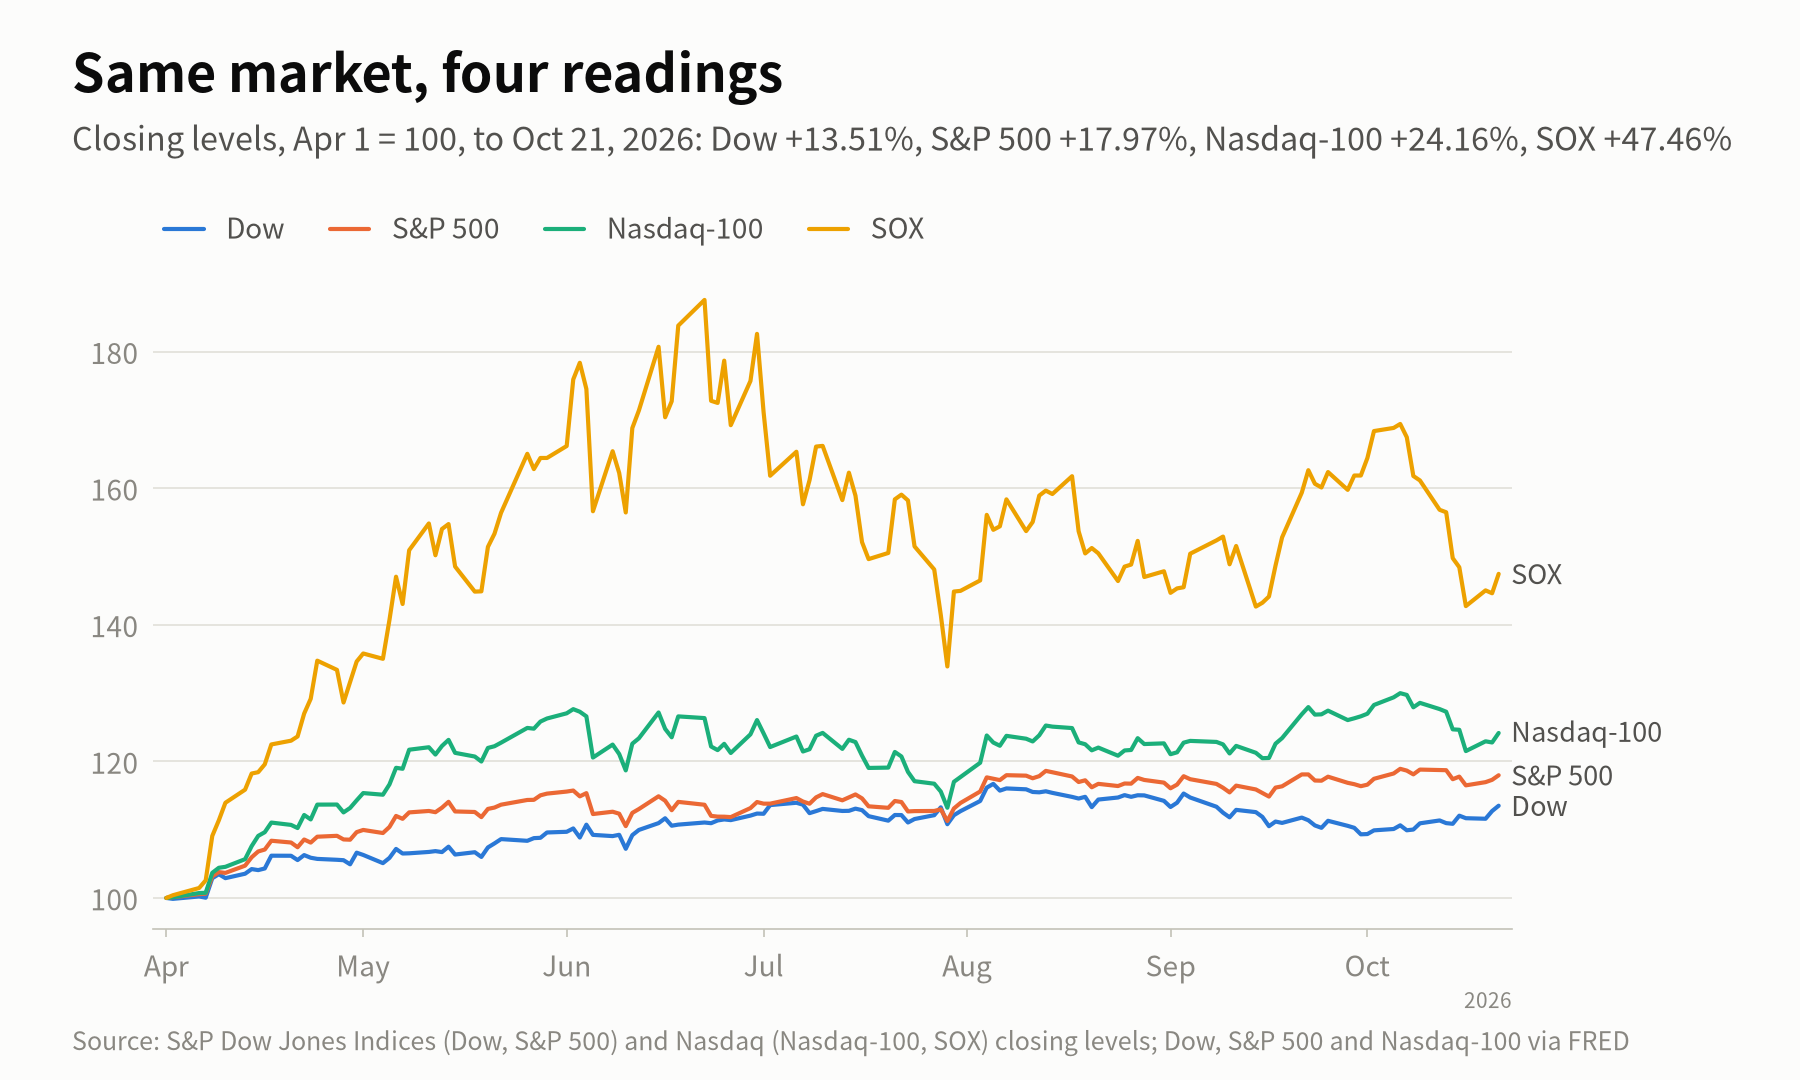
Over that stretch the Dow rose 13.51%, the S&P 500 17.97%, the Nasdaq-100 24.16% and the SOX 47.46%.
Day to day, we counted the 140 sessions from April 2 to October 21, 2026, and compared each pair of indexes:
| Pair | Closed in the same direction | Opposite |
|---|---|---|
| Nasdaq Composite and Nasdaq-100 | 129 | 11 |
| Nasdaq-100 and SOX | 120 | 20 |
| Dow and S&P 500 | 117 | 23 |
| S&P 500 and Nasdaq-100 | 117 | 23 |
| Dow and Nasdaq-100 | 96 | 44 |
The size of the moves differed too. The average daily change, up or down, was 0.59% for both the Dow and the S&P 500, 0.91% for the Nasdaq Composite, 1.02% for the Nasdaq-100 and 2.49% for the SOX. The Dow and the S&P 500 each moved 2% or more on 2 of the 140 sessions, the Nasdaq-100 on 15 and the SOX on 74.
October 22 was a sharp example. The Dow edged up 0.02% to 52,867.98, while the Nasdaq-100 fell 2.90% and the SOX fell 6.72%. For a reader in Asia following chip stocks, the Dow said little about that night.
When do they close in Asian time?
All three are set by the US regular session, which the NYSE lists as 9:30 a.m. to 4:00 p.m. New York time. Until US clocks change on November 1, 2026, the close comes at 5:00 a.m. the next day in Seoul and Tokyo and 4:00 a.m. in Taipei. From November 2 it is one hour later. So Monday’s US closes are known before Tuesday’s open in Asia. One Chip Day, Four Closes covers the hand-off between the four markets. Futures on the three indexes keep trading through the Asian day; US Stock Futures Overnight explains what those numbers show.
Which funds follow them?
Each index has a large US exchange-traded fund built to follow it, and their tickers often appear in place of the index itself:
- SPY, the State Street SPDR S&P 500 ETF Trust, follows the S&P 500.
- DIA, the State Street SPDR Dow Jones Industrial Average ETF Trust, follows the Dow.
- QQQ, the Invesco QQQ, follows the Nasdaq-100, not the Composite.
A fund’s price is not the index level, and the fund can drift slightly from its index because of fees and timing. When a report gives a number such as 52,867.98 or 7,757.17, it refers to the index.
Sources
- Dow Jones Averages Methodology (May 2026)
- S&P U.S. Indices Methodology (July 2026)
- Index Mathematics Methodology (September 2026)
- S&P 500 factsheet (as of September 30, 2026)
- Dow Jones Industrial Average Celebrates 130 Years as Iconic American Benchmark (May 26, 2026)
- NVIDIA and Sherwin-Williams Set to Join Dow Jones Industrial Average (November 1, 2024)
- Alphabet Set to Join and Honeywell International to Remain in Dow Jones Industrial Average (June 23, 2026)
- Sandisk Set to Join S&P 500 (November 24, 2025)
- Nasdaq Composite Index methodology
- Nasdaq-100 Index methodology
- Nasdaq Composite and Nasdaq-100 fact sheets (as of September 30, 2026)
- Overview for NDX (base value and launch date)
- COMP Research 2021 (Nasdaq Composite history)
- Nasdaq-100 constituent list (October 22, 2026)
- Weighting for SOX (constituent list, October 19, 2026)
- SK hynix prospectus, Form 424B4 (July 10, 2026)
- Taiwan Semiconductor Manufacturing Co. company filings (address and exchange)
- State Street SPDR Dow Jones Industrial Average ETF Trust (DIA), holdings
- State Street SPDR S&P 500 ETF Trust (SPY)
- Invesco QQQ ETF
- Holidays and Trading Hours
- Daylight Saving Time
Related reading
More in Explainers
- Chip Stock Heatmap Explained: How to Read the Asia-Pacific Chips MapMarket Map
- Asia Chip Stocks From a US Account: SKHY, TSM, KXIAY and Other TickersExplainers
- Who Makes What in Memory: DRAM, NAND and HBM Across Asia and the USExplainers
- How to Buy Japanese Chip Stocks: Tokyo Shares, OTC ADRs and ETFsGuides
- How to Buy Taiwan Stocks From Abroad: TWSE Shares, TSM and ETFsGuides
- What Do 3nm and 2nm Mean? Chip Process Nodes ExplainedExplainers
- US Chip Export Controls on China, ExplainedExplainers
- What Is CoWoS? TSMC's Advanced Packaging and the AI Chip BottleneckExplainers
- Foundry, Fabless and IDM: How Chipmakers Split the WorkExplainers
- Why Samsung Reports Earnings Twice, and How Other Chipmakers ReportExplainers
- SOXX vs SMH vs SOXQ: How Three Semiconductor ETFs DifferExplainers
- How a Stock Gets Into the S&P 500 and the Nasdaq-100Explainers
- US Stock Futures Overnight: What Dow, S&P 500 and Nasdaq Futures ShowExplainers
- One Chip Day, Four Closes: Seoul, Taipei, Tokyo and New YorkExplainers
- Japan's Margin Trading Data: What It Says About KioxiaExplainers
- Kioxia Outside Japan: 285A in Tokyo vs KXIAY Over the CounterExplainers
- Kioxia's 3-for-1 Split: How to Read Its Price HistoryExplainers
- Micron's Fiscal Calendar: Why Its Quarters Don't Match Samsung'sExplainers
- Nikkei 225 vs TOPIX: Why Chip Stocks Move Them So DifferentlyExplainers
- The Philadelphia Semiconductor Index (SOX) and Why Asia Watches ItExplainers
- Taiwan's 10% Daily Price Limit and Other Rules for Foreign InvestorsExplainers
- TSM vs 2330: Why TSMC's US Shares Trade Above TaipeiExplainers
- TSMC's Monthly Sales: How Taiwan's Monthly Revenue Reports WorkExplainers
- Why One Stock Moves Taiwan's Market: TSMC and the TAIEXExplainers
- How Foreign Investors Move the KOSPI, and Where to See the Daily DataExplainers
- How to Buy Korean Stocks in 2026: 4 Routes for US, Singapore, UKGuides
- How to Buy Samsung Stock Outside Korea: Shares, London GDR and ETFsGuides
- Korea Discount and the Value-up Program, Explained SimplyExplainers
- KOSPI Heatmap Explained: How to Read Korea's Market MapMarket Map
- Why MSCI Still Hasn't Upgraded Korea, and What Would Change ItExplainers
- How Samsung and SK hynix Compare in HBMSamsung & SK hynix
- SKHY vs 000660: How the Two Ways to Own SK hynix DifferSamsung & SK hynix
- Why Is the KOSPI So Volatile? Chips, Foreign Money and the WonExplainers