KOSPI Heatmap Explained: How to Read Korea's Market Map
Size is market value, color is the day’s move. How to read one, using the October 13, 2026 map, when two boxes covered more than half of it.
A KOSPI heatmap, or market map, draws every stock in the index as a box. The size of a box is the company’s market value. The color is how much its share price moved that day. On Pacific Tape’s maps, green means up, red means down and gray means unchanged, as on most US apps. Korean broker apps and news use the opposite colors. Read the sizes first, then the colors. On October 13, 2026, two boxes, Samsung Electronics and SK hynix, covered more than half of the KOSPI 200 map, and both fell sharply. Today’s map, with every KOSPI 200 and KOSDAQ 150 stock, is on the Korea market map page.
All won amounts below are converted at 1,345.1 won per US dollar, the won-dollar rate at the 15:30 Korea time close on October 13, 2026 (Bank of Korea, ECOS).
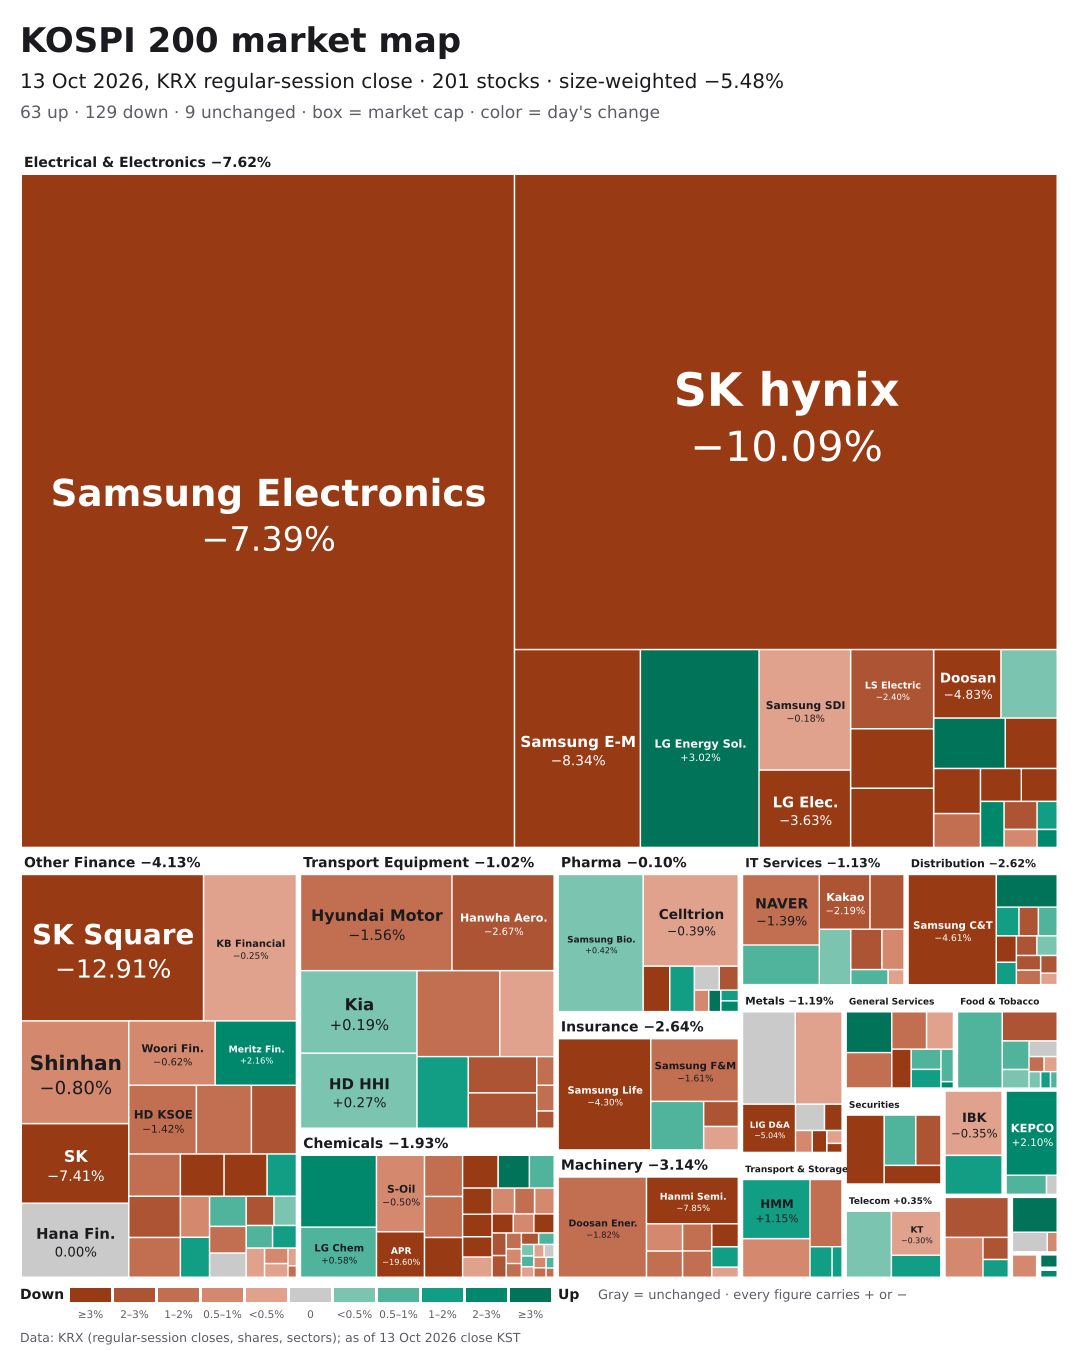
What do the box sizes on a KOSPI heatmap mean?
Each box is sized by market capitalization: the number of listed shares times the closing price. In this map the share counts come from KRX’s industry classification table, dated October 12, and the prices are the regular-session closes on October 13. There are 201 boxes, one for every name on KRX’s KOSPI 200 constituent list dated October 2, 2026, which had 201 entries. Hanwha M&S, spun off from Hanwha Corp. and listed on August 25, 2026, joined the index alongside its parent, which is why the list has 201 names.
All boxes together come to about 4,598.6 trillion won, or roughly US$3.42 trillion.
Two details matter when you compare the map with the index itself:
- The map uses all listed shares. The official KOSPI 200 weights companies by free-float market value, counting only the shares that are freely traded, so each company’s weight in the index differs from its share of the map.
- So the map’s average move is close to the index, but not equal. On October 13, weighted by each company’s market value at the start of the day, the boxes fell 5.68%. TIGER 200, an exchange-traded fund that tracks the KOSPI 200, fell 6.16% that day (TIGER 200 ETF, KRX regular-session close). The two differ partly because the index counts only freely traded shares.
What do the colors mean?
- Green is a rise, red is a fall, and gray means unchanged.
- The color gets stronger in five steps: a move of less than 0.5%, 0.5% to 1%, 1% to 2%, 2% to 3%, and 3% or more. Past 3%, every box has the same full color.
- Every figure on the map carries a + or − sign, and the legend says Up and Down, so the map can be read without relying on color.
The 3% limit is easy to miss. On October 13, APR fell 19.60% and Samsung Electronics fell 7.39%, and both boxes are the same darkest red. The color tells you the direction and roughly how strong the move was. For the exact number, read the label.
A note on Korean sources: Korean broker apps and news use the opposite colors, red for a rise and blue for a fall. A Korean map that looks mostly red is a market that went up. Whatever map you open, read the legend first.
Why do Samsung Electronics and SK hynix dominate the map?
Because they are by far the biggest companies. On October 13:
- Samsung Electronics: 1,356.3 trillion won (about US$1.01 trillion), or 29.5% of the map.
- SK hynix: 1,054.1 trillion won (about US$784 billion), or 22.9%.
Together that is 52.4% of the KOSPI 200 map by market value. Both are among the world’s biggest memory chip makers, so one industry carries half the picture.
This changes how to read a headline like “KOSPI falls 5%”. On October 13, weighted by each company’s market value at the start of the day, the boxes fell 5.68%. Samsung Electronics alone accounted for 2.22 percentage points of that, and SK hynix for 2.43 points. That is 4.65 points from two stocks. The other 199 stocks on the map fell 2.25% on average, weighted the same way, and the median stock fell just 0.76%. 63 stocks rose, 129 fell and 9 were unchanged.
In other words, much of that day’s fall came from two companies. The same is true on strong days: a big rise in the index can come mostly from the same two boxes while most other stocks barely move. A heatmap makes this visible in a way that a single index number cannot.
Other boxes can be tied to the same two companies. SK Square, which fell 12.91% that day, is a holding company whose biggest asset is its stake of about 20% in SK hynix.
How do you read the sector groups?
The boxes are grouped by industry, using KRX’s sector classification. We have translated the sector names into English. Each group’s label shows the size-weighted move of the stocks in it.
On October 13:
- Electrical & Electronics (22 stocks) made up 62.0% of the map and was the weakest group, down 7.62%.
- Other Finance (30 stocks, 10.2% of the map) fell 4.13%. In KRX’s system this group holds financial groups and holding companies such as KB Financial, Shinhan and SK Square.
- The strongest groups were small ones: Entertainment & Culture rose 2.76% and Utilities (electricity and gas) rose 1.79%, each with only three stocks.
A group with three stocks can top the list because of one company’s move, so it helps to check how many boxes are behind a group’s number.
The largest single moves were:
- Down: APR −19.60%, SK Square −12.91%, SK hynix −10.09%, d’Alba Global −8.44%, Samsung Electro-Mechanics −8.34%
- Up: HYBE +4.41%, Hanwha Systems +3.86%, SKC +3.63%, HD Hyundai Marine Solution +3.63%, Daewoong Pharmaceutical +3.57%
What can a one-day market map tell you, and what can’t it?
A one-day map is good at three things:
- Concentration: whether a move came from a few giants or from the whole market.
- Breadth: how many stocks rose and how many fell.
- Sector pattern: which industries held up and which led the fall.
It cannot tell you:
- Why prices moved. The map has no news in it.
- Who was buying and selling. For that, see our guide to how foreign investors move the KOSPI.
- How much was traded. A box looks the same on a quiet day and a busy one.
- The trend. One day says little about the weeks before or after it.
- Whether a stock is cheap or expensive. A red box is a falling price, not a judgment about the company.
Where can you see a KOSPI heatmap?
Pacific Tape plans to publish a map like this one for each trading day, drawn from the regular-session close with the data source and date under the picture.
Most Korean broker apps and finance portals offer a similar map, usually with red for up and blue for down.
Whichever map you use, check three things first: which index it covers (KOSPI 200, the full KOSPI, or KOSDAQ), what the legend says about which color means up, and what time the prices are from. A map drawn during the session will look different from one drawn at the close.
Sources
See today’s Korea market map →
Related reading
More in Explainers
- Chip Stock Heatmap Explained: How to Read the Asia-Pacific Chips MapMarket Map
- Asia Chip Stocks From a US Account: SKHY, TSM, KXIAY and Other TickersExplainers
- Who Makes What in Memory: DRAM, NAND and HBM Across Asia and the USExplainers
- How to Buy Japanese Chip Stocks: Tokyo Shares, OTC ADRs and ETFsGuides
- How to Buy Taiwan Stocks From Abroad: TWSE Shares, TSM and ETFsGuides
- What Do 3nm and 2nm Mean? Chip Process Nodes ExplainedExplainers
- US Chip Export Controls on China, ExplainedExplainers
- What Is CoWoS? TSMC's Advanced Packaging and the AI Chip BottleneckExplainers
- Foundry, Fabless and IDM: How Chipmakers Split the WorkExplainers
- Why Samsung Reports Earnings Twice, and How Other Chipmakers ReportExplainers
- SOXX vs SMH vs SOXQ: How Three Semiconductor ETFs DifferExplainers
- How a Stock Gets Into the S&P 500 and the Nasdaq-100Explainers
- Dow, S&P 500 and Nasdaq: What Each US Stock Index MeasuresExplainers
- US Stock Futures Overnight: What Dow, S&P 500 and Nasdaq Futures ShowExplainers
- One Chip Day, Four Closes: Seoul, Taipei, Tokyo and New YorkExplainers
- Japan's Margin Trading Data: What It Says About KioxiaExplainers
- Kioxia Outside Japan: 285A in Tokyo vs KXIAY Over the CounterExplainers
- Kioxia's 3-for-1 Split: How to Read Its Price HistoryExplainers
- Micron's Fiscal Calendar: Why Its Quarters Don't Match Samsung'sExplainers
- Nikkei 225 vs TOPIX: Why Chip Stocks Move Them So DifferentlyExplainers
- The Philadelphia Semiconductor Index (SOX) and Why Asia Watches ItExplainers
- Taiwan's 10% Daily Price Limit and Other Rules for Foreign InvestorsExplainers
- TSM vs 2330: Why TSMC's US Shares Trade Above TaipeiExplainers
- TSMC's Monthly Sales: How Taiwan's Monthly Revenue Reports WorkExplainers
- Why One Stock Moves Taiwan's Market: TSMC and the TAIEXExplainers
- How Foreign Investors Move the KOSPI, and Where to See the Daily DataExplainers
- How to Buy Korean Stocks in 2026: 4 Routes for US, Singapore, UKGuides
- How to Buy Samsung Stock Outside Korea: Shares, London GDR and ETFsGuides
- Korea Discount and the Value-up Program, Explained SimplyExplainers
- Why MSCI Still Hasn't Upgraded Korea, and What Would Change ItExplainers
- How Samsung and SK hynix Compare in HBMSamsung & SK hynix
- SKHY vs 000660: How the Two Ways to Own SK hynix DifferSamsung & SK hynix
- Why Is the KOSPI So Volatile? Chips, Foreign Money and the WonExplainers