SOX Heatmap Explained: How to Read the US Chip Index Map
Nvidia's box takes up more than a third of the SOX map, but the index itself caps Nvidia at 12%. That gap is the key to reading the map: the boxes show how big each company is, and the headline number moves the way the index does. A walk through the October 27, 2026 map.
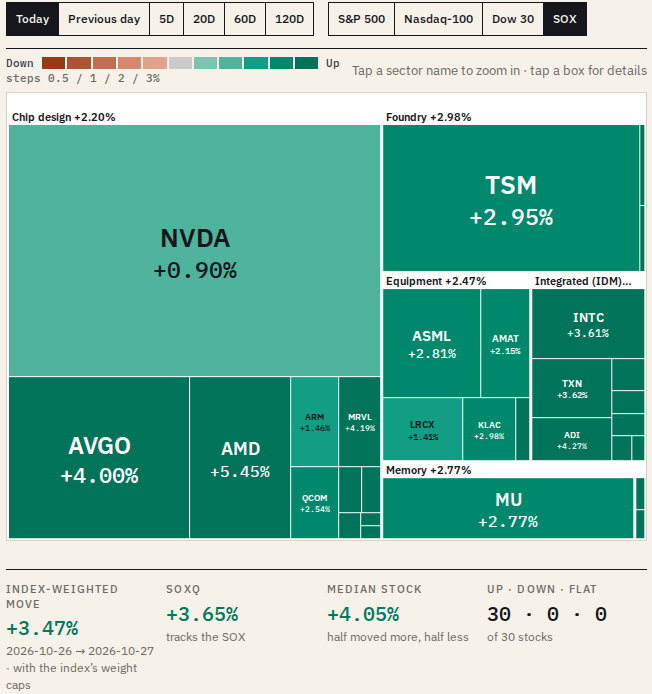
The SOX map on Pacific Tape draws the 30 stocks of the PHLX Semiconductor Sector Index (SOX), Nasdaq’s index of the 30 largest US-listed chip companies. The size of a box is the company’s market value in US dollars. The color is how much its share price moved. Green means up, red means down and gray means unchanged.
The SOX map is the fourth button on the US map, after S&P 500, Nasdaq-100 and Dow 30, and it has its own page. It differs from the other three in one way that matters: the boxes are sized by full market value, while the headline number uses the index’s own weight caps. The examples below all come from the October 27, 2026 close.
Which stocks are on the SOX map?
The 30 members of the index, which Nasdaq picks once a year. Its methodology says the index is “designed to measure the performance of the 30 largest US-listed semiconductor companies,” and the list changes “at market open on the first trading day after the third Friday in September.” ADRs are eligible, so TSMC, ASML and Arm are in it through their US listings.
The map groups the 30 by what they do in the chip business, not by stock market sector, because all 30 sit in the same sector, Information Technology:
| Group | Stocks | Share of the map |
|---|---|---|
| Chip design | Nvidia, Broadcom, AMD, Arm, Marvell, Qualcomm, Monolithic Power, Astera Labs, Credo, SiTime, Lattice | 58.66% |
| Foundry | TSMC, GlobalFoundries, Tower Semiconductor | 15.74% |
| Equipment | ASML, Applied Materials, Lam Research, KLA, Teradyne | 10.19% |
| Integrated (IDM) | Intel, Texas Instruments, Analog Devices, NXP, Coherent, Microchip, ON Semiconductor, MACOM | 7.93% |
| Memory | Micron | 7.15% |
| Materials | Qnity Electronics, Entegris | 0.33% |
Design companies draw chips and have them made; foundries make chips for others; integrated makers do both in their own plants. Foundry, Fabless and IDM explains the three models, and Chip Equipment Makers covers the equipment group.
Why are Nvidia’s and Broadcom’s boxes so big?
Because a box’s area is the company’s market value, its shares times its latest close, and those two are among the most valuable companies in the world. On October 27, Nvidia’s box was US$5.25 trillion, or 35.75% of the map’s US$14.69 trillion. TSMC was 15.42% and Broadcom 11.12%, so the top three covered 62.3%. The smallest boxes, SiTime and Lattice Semiconductor, were about 0.1% each.
TSMC’s box is the whole company valued at its US share price: the ADS price times its common shares divided by five, since, as TSMC’s annual report puts it, “each ADS represents five (5) common shares.” The ADS traded above the Taipei shares, so TSMC’s box on the SOX map, US$2.27 trillion, was larger than its box on the Chips map, which uses the Taipei close (US$1.91 trillion).
The SOX map has no box-size menu: the boxes always show market value, so Nvidia’s size is the real proportion. Tap a group name to zoom in; tap a box to see the stock’s move, its group and its weight in the index.
How is the index weighted?
Not by full market value. Each quarter, Nasdaq caps the members: “The weights of the top three (3) Index Securities by market capitalization, may not exceed 12%, 10%, 8%, respectively,” and “the individual weights of other Index Securities may not exceed 4%.” Excess weight goes to the smaller members. For ADRs, the index counts only the shares on deposit with the US depositary bank, so a foreign company “may be included in the Index at less than its full global market capitalization.”
Applied to the October 27 closes, the caps gave these weights, which the map shows when you tap a box:
| Stock | Share of the map | Weight with the caps |
|---|---|---|
| Nvidia | 35.75% | 12.0% |
| TSMC | 15.42% | 10.0% |
| Broadcom | 11.12% | 8.0% |
| Micron, AMD, ASML, Intel and 8 others | 1.32% to 7.15% | 4.0% each |
| The other 15 | 0.10% to 0.44% | 0.62% to 2.71% |
So the caps shrink the three largest and lift everyone else. Applied Materials, Lam Research and KLA were each about 2% of the map but 4% of the weights, and the five equipment makers together went from 10.19% of the map to 18.14% of the weights. The weights are the map’s estimate from each session’s closes and full share counts; Nasdaq’s official weights are set at each quarterly rebalance. The Philadelphia Semiconductor Index (SOX) covers how the index is built and reviewed.
Why can the headline and the boxes tell different stories?
Below the map the page shows the index-weighted move, the SOXQ move, the median stock and up · down · flat. SOXQ, the Invesco PHLX Semiconductor ETF, is a fund that tracks the index.
On October 27 all 30 stocks rose. The index-weighted move was +3.47%, SOXQ rose 3.65% and the median stock 4.05%. Weighted by full market value, the same 30 stocks rose only 2.54%. The difference is mostly Nvidia: it had the smallest gain of the 30, 0.90%, and it is 35.75% of the picture but 12% of the index. Credo Technology and Astera Labs had the biggest gains, 10.77% and 10.47%, in two of the smaller boxes.
The index-weighted move is Pacific Tape’s calculation, not the official SOX value, and it can drift from SOXQ over longer periods. Through October 27, the map showed −9.04% over 20 sessions against −9.05% for SOXQ, and −0.75% over 120 sessions against +0.07%.
Group labels carry their own moves: Chip design +2.20%, Foundry +2.98%, Equipment +2.47%, Integrated (IDM) +3.98% and Memory +2.77%. The summary sentence under the map names the biggest group move only among groups of three or more stocks, so it named Integrated (IDM) that day.
What do the colors mean?
The color is the move over the period you pick: Today, which shows the latest close after the market shuts, Previous day, or 5D, 20D, 60D and 120D in US trading days. For one day the shades step at 0.5%, 1%, 2% and 3% each side, as the legend above the map shows.
Which day is the map showing?
The latest US regular session, 9:30 a.m. to 4:00 p.m. New York time, which ends before dawn in Seoul, Taipei and Tokyo. While the US market is open the map refreshes about every 15 minutes, and after the close it keeps the closing prices until the next session opens.
What can the SOX map tell you, and what can’t it?
It shows which US-listed chip companies are big, how a day’s move spread across design, manufacturing and equipment, and how the index’s caps change the headline. It does not show the official index level, and one session’s colors say nothing about the next. For the funds built on this and other chip indexes, see SOXX vs SMH vs SOXQ; for the full US market, see the S&P 500 heatmap explainer.
Sources
Related reading
More in Explainers
- Chip Stock Heatmap Explained: How to Read the Asia-Pacific Chips MapMarket Map
- Asia Chip Stocks From a US Account: SKHY, TSM, KXIAY and Other TickersExplainers
- Who Makes What in Memory: DRAM, NAND and HBM Across Asia and the USExplainers
- Samsung vs SK hynix: How Korea's Two Memory Giants DifferSamsung & SK hynix
- TSMC in Japan: What Is JASM, the Kumamoto Chip Plant?Explainers
- What Is HBM? High-Bandwidth Memory vs DRAM, HBM3E and HBM4Explainers
- SOXL and SOXS Explained: 3x Leveraged and Inverse Chip ETFsExplainers
- Custom AI Chips Explained: Google TPU, Amazon Trainium and ASICsExplainers
- Where Japan Fits in the Chip Supply Chain, Next to Taiwan and KoreaExplainers
- Taiwan's Chip Stocks: Who Makes WhatExplainers
- What Samsung Electronics Makes: Chips, Phones, Displays and MoreSamsung & SK hynix
- Japan's Chip Stocks: Who Makes WhatExplainers
- Why Nvidia's Earnings Move Memory StocksExplainers
- Chip Equipment Makers: ASML, Applied, Lam, KLA and Tokyo ElectronExplainers
- Memory Stock Map Explained: DRAM, NAND and HBM Makers in One ViewMarket Map
- S&P 500 Heatmap Explained: How to Read the US Market MapMarket Map
- How to Buy Japanese Chip Stocks: Tokyo Shares, OTC ADRs and ETFsGuides
- How to Buy Taiwan Stocks From Abroad: TWSE Shares, TSM and ETFsGuides
- What Do 3nm and 2nm Mean? Chip Process Nodes ExplainedExplainers
- US Chip Export Controls on China, ExplainedExplainers
- What Is CoWoS? TSMC's Advanced Packaging and the AI Chip BottleneckExplainers
- Foundry, Fabless and IDM: How Chipmakers Split the WorkExplainers
- Why Samsung Reports Earnings Twice, and How Other Chipmakers ReportSamsung & SK hynix
- SOXX vs SMH vs SOXQ: How Three Semiconductor ETFs DifferExplainers
- How a Stock Gets Into the S&P 500 and the Nasdaq-100Explainers
- Dow, S&P 500 and Nasdaq: What Each US Stock Index MeasuresExplainers
- US Stock Futures Overnight: What Dow, S&P 500 and Nasdaq Futures ShowExplainers
- One Chip Day, Four Closes: Seoul, Taipei, Tokyo and New YorkExplainers
- Japan's Margin Trading Data: What It Says About KioxiaExplainers
- Kioxia Outside Japan: 285A in Tokyo vs KXIAY Over the CounterExplainers
- Kioxia's 3-for-1 Split: How to Read Its Price HistoryExplainers
- Micron's Fiscal Calendar: Why Its Quarters Don't Match Samsung'sExplainers
- Nikkei 225 vs TOPIX: Why Chip Stocks Move Them So DifferentlyExplainers
- The Philadelphia Semiconductor Index (SOX) and Why Asia Watches ItExplainers
- Taiwan's 10% Daily Price Limit and Other Rules for Foreign InvestorsExplainers
- TSM vs 2330: Why TSMC's US Shares Trade Above TaipeiExplainers
- TSMC's Monthly Sales: How Taiwan's Monthly Revenue Reports WorkExplainers
- Why One Stock Moves Taiwan's Market: TSMC and the TAIEXExplainers
- How Foreign Investors Move the KOSPI, and Where to See the Daily DataExplainers
- How to Buy Korean Stocks in 2026: 4 Routes for US, Singapore, UKGuides
- How to Buy Samsung Stock Outside Korea: Shares, London GDR and ETFsGuides
- Korea Discount and the Value-up Program, Explained SimplyExplainers
- KOSPI Heatmap Explained: How to Read Korea's Market MapMarket Map
- Why MSCI Still Hasn't Upgraded Korea, and What Would Change ItExplainers
- How Samsung and SK hynix Compare in HBMSamsung & SK hynix
- SKHY vs 000660: How the Two Ways to Own SK hynix DifferSamsung & SK hynix
- Why Is the KOSPI So Volatile? Chips, Foreign Money and the WonExplainers