Where Japan Fits in the Chip Supply Chain, Next to Taiwan and Korea
Asia's three big chip markets do different jobs. Taiwan's stocks are mostly companies that make chips for others, Korea's are its two memory makers, and Japan's are mostly the companies that sell chipmakers their machines and materials. Here is how that looks on our maps and in official figures from Tokyo, Seoul and Taipei.
Ask what Taiwan does in chips and the answer is TSMC: it makes chips other companies design. Ask about Korea and it is memory, from Samsung Electronics and SK hynix. The US designs most of the world’s best-known chips. Japan’s answer is less visible: its listed chip companies mostly sell the machines, chemicals and wafers that the others use to make chips.
What do our maps show?
The Chips map on Pacific Tape draws 41 chip stocks from Korea, Taiwan, Japan and the US, each with a role. Splitting each market’s value by role shows four different shapes:
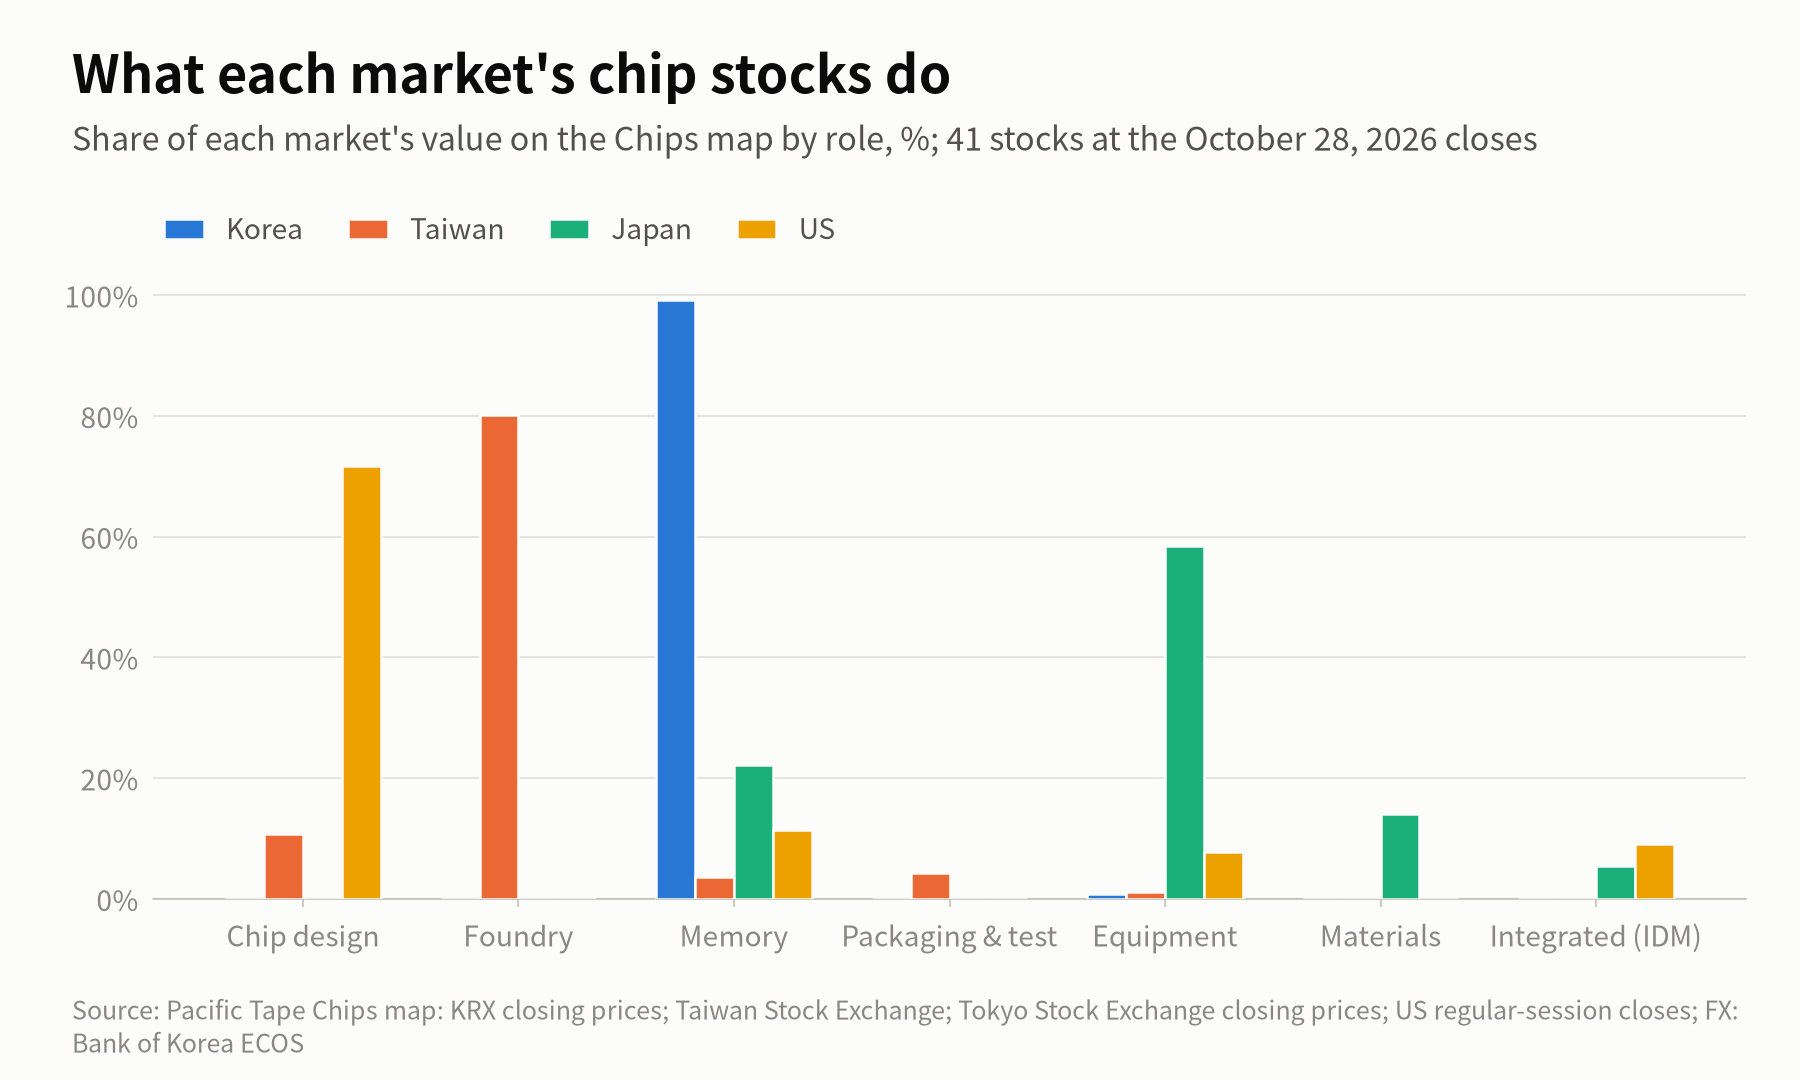
| Market | Stocks on the map | Share of the map | Largest role |
|---|---|---|---|
| US | 16 | 69.7% | Chip design, 71.7% of its value |
| Taiwan | 12 | 14.9% | Foundry, 80.2% |
| Korea | 3 | 11.3% | Memory, 99.2% |
| Japan | 10 | 4.1% | Equipment, 58.4% |
Japan’s ten stocks are six equipment makers, led by Advantest and Tokyo Electron; Kioxia in NAND memory; Shin-Etsu Chemical and JX Advanced Metals in materials; and the chipmaker Renesas Electronics. All of the map’s materials value is Japanese, and Japan has 29% of its equipment value; US companies have most of the rest, and the Dutch lithography maker ASML is not on this map.
The map is a selection, not a census. Korea’s three stocks are Samsung Electronics, SK hynix and Hanmi Semiconductor, so Korea’s other equipment and materials companies are not counted here. Japan’s own map holds 22 chip stocks, covered in Japan’s Chip Stocks: Who Makes What, and Taiwan’s holds 20, in Taiwan’s Chip Stocks: Who Makes What.
How big is Japan in chip equipment?
Large, but not in the biggest tools. A December 2025 strategy paper from Japan’s Ministry of Economy, Trade and Industry (METI), drawing on data from the research firm Global Net, shows Japanese companies with 28% of chip equipment sales by headquarters country, against 37% for US companies, 27% for European ones, 6% for Chinese, 3% for Korean and 0% for Taiwanese.
METI is blunt about where that share sits. “Japan’s high-share areas are equipment groups with relatively small markets,” it says in Japanese (our translation), “and it has not won share in lithography, thin-film deposition and etching, where the market size is large.” Its chart shows Tokyo Electron with 85% of coater/developers, the tools that coat and develop wafers around lithography. But between 2021 and 2023, METI’s figures show Japan’s share falling from 26% to 16% in lithography, from 37% to 25% in etching and from 30% to 19% in deposition, while it rose in cleaning and in logic testers.
And in materials?
There Japan’s position is stronger. “Japan continues to hold high shares in the materials market,” METI’s paper says (our translation), citing Fuji Keizai data for 2023:
| Material | Japanese companies’ share, 2023 |
|---|---|
| Photoresists | 78% |
| CMP pads | 72% |
| High-purity cleaning liquids | 59% |
| Silicon wafers | 53% |
| CMP slurry | 51% |
The same slide warns that competition is changing in some materials. Tokyo Ohka Kogyo, Shin-Etsu Chemical and SUMCO, all on our Japan map, are among the companies behind those numbers.
Who buys Japan’s tools?
Mostly chipmakers in other countries. Japan exported ¥4.55 trillion of chipmaking equipment and parts in 2025, according to the Ministry of Finance’s trade statistics for HS code 8486, which also includes machines for making flat-panel displays:
| Destination | 2025 exports | Share | 2024 share |
|---|---|---|---|
| China | ¥1.91 trillion | 42.0% | 48.4% |
| Taiwan | ¥1.11 trillion | 24.4% | 16.3% |
| Korea | ¥0.71 trillion | 15.7% | 14.2% |
| US | ¥0.37 trillion | 8.1% | 11.8% |
That matches where the world’s tools went. SEMI, the equipment industry association, put 2025 equipment spending at US$135.1 billion: US$49.3 billion in mainland China, a record US$31.5 billion in Taiwan, US$25.8 billion in Korea and US$9.5 billion in Japan itself.
The Semiconductor Equipment Association of Japan (SEAJ) counts the sales of Japanese equipment makers, at home and abroad, at ¥5.20 trillion in the fiscal year to March 2026. In July it forecast ¥6.55 trillion for the year to March 2027, up 26%. In its words (our translation), the reasons were “strong investment in advanced logic for AI servers” and “a large increase in DRAM investment, centered on HBM.” For the five largest toolmakers’ own numbers, see Chip Equipment Makers; for the US rules on what can be sold to China, see US Chip Export Controls on China.
How do Taiwan and Korea compare?
Their official figures show the same split as the map.
Taiwan. The Taiwan Semiconductor Industry Association puts the island’s 2025 chip-industry output at NT$6.52 trillion, counting only companies headquartered in Taiwan. Foundry was NT$4.17 trillion of it, 64%; IC design NT$1.42 trillion, 22%; packaging NT$483 billion and testing NT$229 billion; and memory and other manufacturing NT$218 billion, about 3%.
Korea. Korea’s trade ministry reported record chip exports of US$173.4 billion in 2025, 24.4% of all its exports. Memory was US$119.0 billion of that, about 69%, and system chips US$48.0 billion. Korea is also a big buyer of tools: it imported US$21.8 billion of chipmaking equipment in 2025.
Japan as a chip market. World Semiconductor Trade Statistics puts chip sales in Japan at US$44.7 billion in 2025, down 4.3%, out of a world total of US$795.6 billion. Japan still makes chips, through Kioxia in NAND, Renesas in microcontrollers and others, and Rapidus aims to make 2nm logic chips; its plans are covered in What Do 3nm and 2nm Mean?
What does this mean for reading the stocks?
That Japan’s chip stocks are mostly a bet on other countries’ chipmakers spending. When TSMC, Samsung, SK hynix or Chinese chipmakers build fabs, a large part of the machines and materials comes from Japanese companies, and their sales show it: Taiwan’s share of Japan’s equipment exports rose from 16% to 24% in 2025 as Taiwan’s own equipment spending set a record. Korea’s stocks, by contrast, move with memory, and Taiwan’s with TSMC. For the memory side of the picture, see Who Makes What in Memory.
Sources
- 半導体・デジタル産業戦略の今後の方向性 (Executive Summary), December 23, 2025
- 半導体・FPD製造装置 需要予測 (2026年度~2028年度), July 2, 2026
- 2025年 品別国別表 (輸出, 84-85類), 普通貿易統計
- SEMI Reports Global Semiconductor Equipment Billings Reached $135 Billion in 2025 (April 8, 2026)
- 2025년 연간 및 12월 수출입 동향 (January 1, 2026)
- TSIA Q4 2025 and Year 2025 Statistics on Taiwan IC Industry (February 12, 2026)
- WSTS Semiconductor Market Forecast Spring 2026 (June 2, 2026)
Related reading
- Japan's Chip Stocks: Who Makes What Explainers
- TSMC in Japan: What Is JASM, the Kumamoto Chip Plant? Explainers
- Taiwan's Chip Stocks: Who Makes What Explainers
More in Explainers
- Chip Stock Heatmap Explained: How to Read the Asia-Pacific Chips MapMarket Map
- Asia Chip Stocks From a US Account: SKHY, TSM, KXIAY and Other TickersExplainers
- Who Makes What in Memory: DRAM, NAND and HBM Across Asia and the USExplainers
- Samsung vs SK hynix: How Korea's Two Memory Giants DifferSamsung & SK hynix
- TSMC in Japan: What Is JASM, the Kumamoto Chip Plant?Explainers
- What Is HBM? High-Bandwidth Memory vs DRAM, HBM3E and HBM4Explainers
- SOXL and SOXS Explained: 3x Leveraged and Inverse Chip ETFsExplainers
- Custom AI Chips Explained: Google TPU, Amazon Trainium and ASICsExplainers
- Taiwan's Chip Stocks: Who Makes WhatExplainers
- What Samsung Electronics Makes: Chips, Phones, Displays and MoreSamsung & SK hynix
- Japan's Chip Stocks: Who Makes WhatExplainers
- Why Nvidia's Earnings Move Memory StocksExplainers
- Chip Equipment Makers: ASML, Applied, Lam, KLA and Tokyo ElectronExplainers
- SOX Heatmap Explained: How to Read the US Chip Index MapMarket Map
- Memory Stock Map Explained: DRAM, NAND and HBM Makers in One ViewMarket Map
- S&P 500 Heatmap Explained: How to Read the US Market MapMarket Map
- How to Buy Japanese Chip Stocks: Tokyo Shares, OTC ADRs and ETFsGuides
- How to Buy Taiwan Stocks From Abroad: TWSE Shares, TSM and ETFsGuides
- What Do 3nm and 2nm Mean? Chip Process Nodes ExplainedExplainers
- US Chip Export Controls on China, ExplainedExplainers
- What Is CoWoS? TSMC's Advanced Packaging and the AI Chip BottleneckExplainers
- Foundry, Fabless and IDM: How Chipmakers Split the WorkExplainers
- Why Samsung Reports Earnings Twice, and How Other Chipmakers ReportSamsung & SK hynix
- SOXX vs SMH vs SOXQ: How Three Semiconductor ETFs DifferExplainers
- How a Stock Gets Into the S&P 500 and the Nasdaq-100Explainers
- Dow, S&P 500 and Nasdaq: What Each US Stock Index MeasuresExplainers
- US Stock Futures Overnight: What Dow, S&P 500 and Nasdaq Futures ShowExplainers
- One Chip Day, Four Closes: Seoul, Taipei, Tokyo and New YorkExplainers
- Japan's Margin Trading Data: What It Says About KioxiaExplainers
- Kioxia Outside Japan: 285A in Tokyo vs KXIAY Over the CounterExplainers
- Kioxia's 3-for-1 Split: How to Read Its Price HistoryExplainers
- Micron's Fiscal Calendar: Why Its Quarters Don't Match Samsung'sExplainers
- Nikkei 225 vs TOPIX: Why Chip Stocks Move Them So DifferentlyExplainers
- The Philadelphia Semiconductor Index (SOX) and Why Asia Watches ItExplainers
- Taiwan's 10% Daily Price Limit and Other Rules for Foreign InvestorsExplainers
- TSM vs 2330: Why TSMC's US Shares Trade Above TaipeiExplainers
- TSMC's Monthly Sales: How Taiwan's Monthly Revenue Reports WorkExplainers
- Why One Stock Moves Taiwan's Market: TSMC and the TAIEXExplainers
- How Foreign Investors Move the KOSPI, and Where to See the Daily DataExplainers
- How to Buy Korean Stocks in 2026: 4 Routes for US, Singapore, UKGuides
- How to Buy Samsung Stock Outside Korea: Shares, London GDR and ETFsGuides
- Korea Discount and the Value-up Program, Explained SimplyExplainers
- KOSPI Heatmap Explained: How to Read Korea's Market MapMarket Map
- Why MSCI Still Hasn't Upgraded Korea, and What Would Change ItExplainers
- How Samsung and SK hynix Compare in HBMSamsung & SK hynix
- SKHY vs 000660: How the Two Ways to Own SK hynix DifferSamsung & SK hynix
- Why Is the KOSPI So Volatile? Chips, Foreign Money and the WonExplainers