Flying Roadster, Grounded Profit: Tesla’s Q3 in 5 Numbers
Tesla reported its third-quarter results after the US market closed on October 21. Operating income was $718 million, down 56% from a year earlier. Yet the gross margin it earns on its cars came to 19.6%, higher than both a year earlier and the previous quarter. What cut into profit was not car sales but higher spending on AI and robots, and the stock is walking slowly below its July high.
Numbers 1 and 2: Revenue flat, operating income cut by more than half
Revenue was $28.05 billion, almost the same as a year earlier ($28.09 billion). It was also close to the market consensus (about $28.06 billion).
The businesses moved in different directions.
- Automotive: $20.56 billion, down 3%
- Energy storage: $2.88 billion, down 16%
- Services and other: $4.61 billion, up 33%
The operating margin was 2.6%, less than half the 5.8% of a year earlier. It was, however, up from 1.4% in the previous quarter.
Each car is earning more, not less
Gross margin is revenue minus only the cost of making the cars and batteries, as a share of revenue. In Q3 it was 19.6%, above 16.8% in Q2 and 18.0% a year earlier. Automotive gross margin excluding regulatory credit sales also rose, from 16.3% in Q2 to 18.1%.
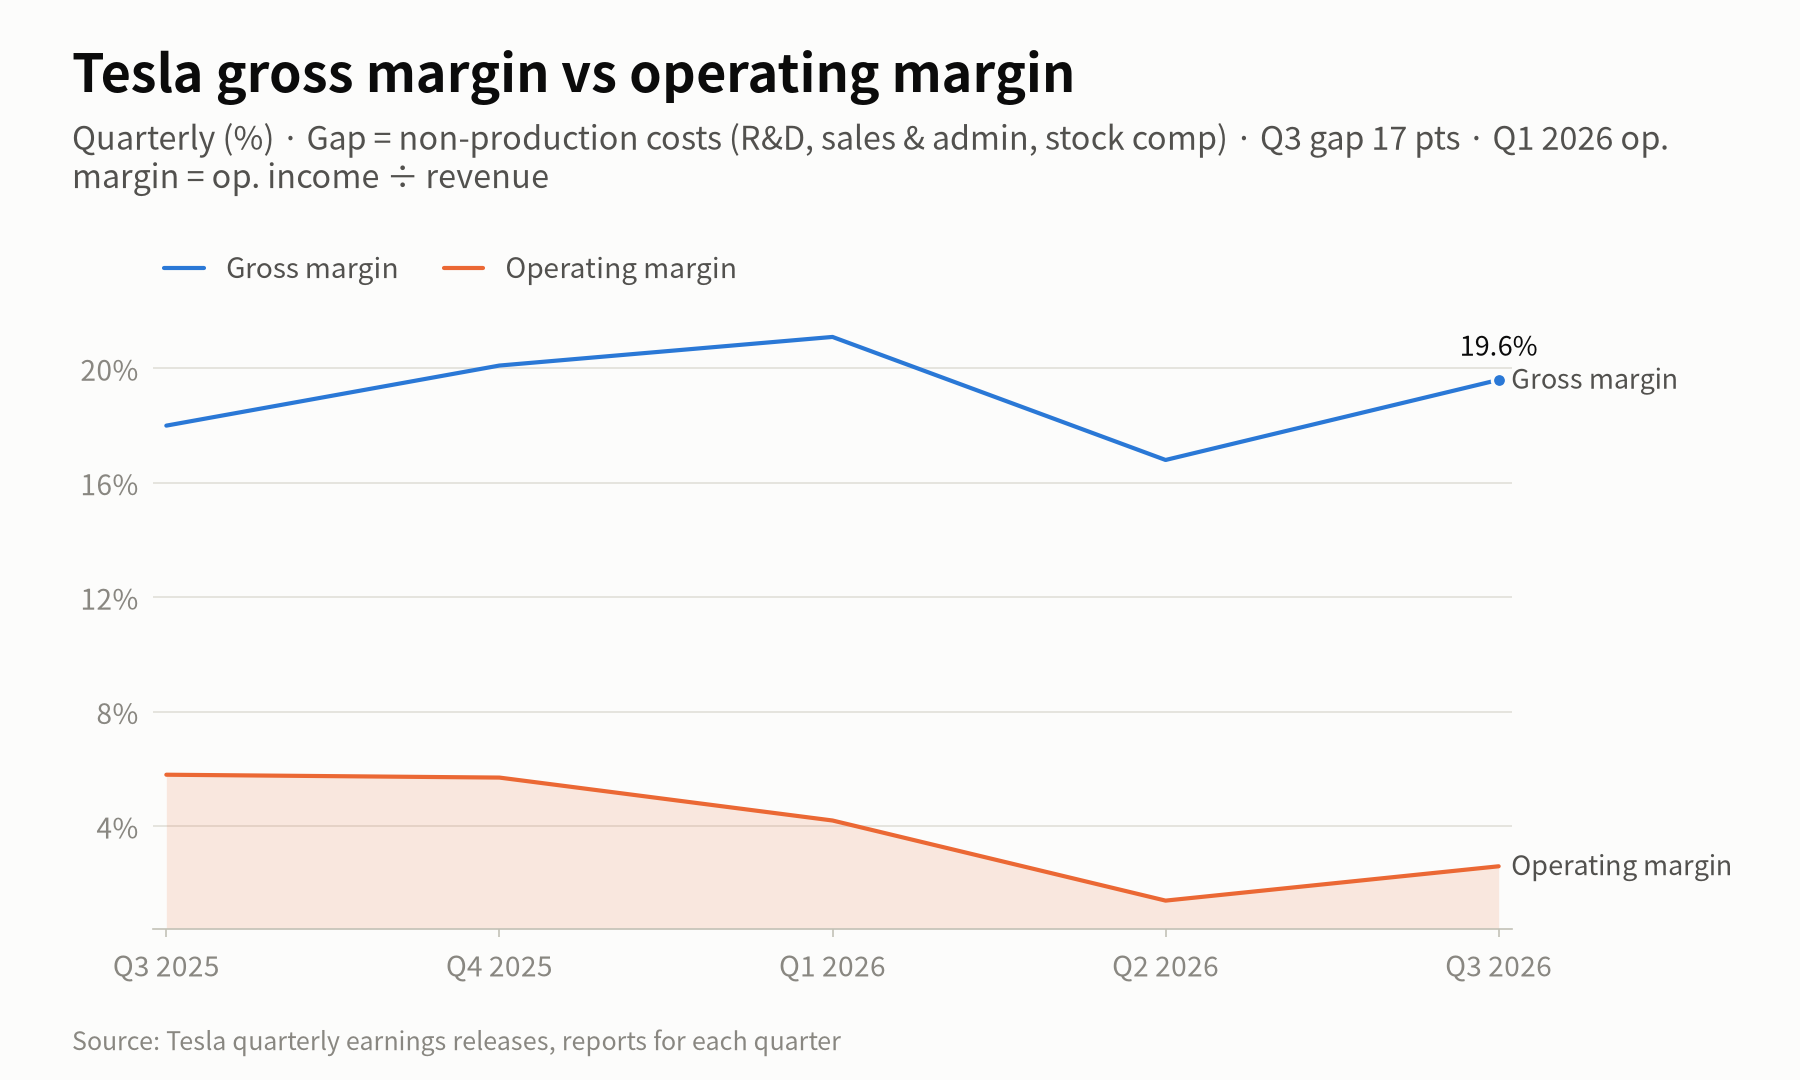
The wider the gap between the two lines, the more of the profit went to expenses outside production costs (R&D, sales and administrative costs, and stock-based compensation). In Q3 the gap was 17 percentage points.
Free cash flow was $1.53 billion, turning positive from about $1.1 billion negative in Q2.
So why did operating income fall 56%?
Operating expenses were $4.8 billion, up 39% from a year earlier. Of that, R&D spending was $2.76 billion, up 69%. Tesla pointed to computing for AI training (“super intelligence”), its Optimus humanoid robot and development of the Cybercab.
Stock-based compensation also came to $1.17 billion, nearly double the year-earlier figure ($660 million). That figure includes Musk’s performance award approved in 2025.
The other three numbers: deliveries, FSD and robotaxis
Number 3: 486,532 deliveries
Deliveries were down about 2% from a year earlier but beat the consensus compiled by Tesla (461,974) by 5.3%. The company said its passenger-car order backlog is the largest in four years and that battery supply is what is holding back sales.
Number 4: 1.74 million FSD users
Users of FSD (Full Self-Driving), Tesla’s driver-assistance feature, rose 67% from a year earlier. The figure includes not only monthly subscribers but also people who paid for it outright. Tesla said more than 75% of new cars in North America signed up for FSD at delivery, but every new car comes with a one-month free trial, so the paid share may be lower.
Number 5: About 2 million cumulative driverless robotaxi miles
The two-seat Cybercab, which has no steering wheel or pedals, joined the Austin robotaxi fleet on September 3. By the end of the quarter, the robotaxi fleet had logged about 2 million cumulative driverless miles (about 3.2 million km), an eightfold increase in a single quarter.
The car flew; the stock is walking
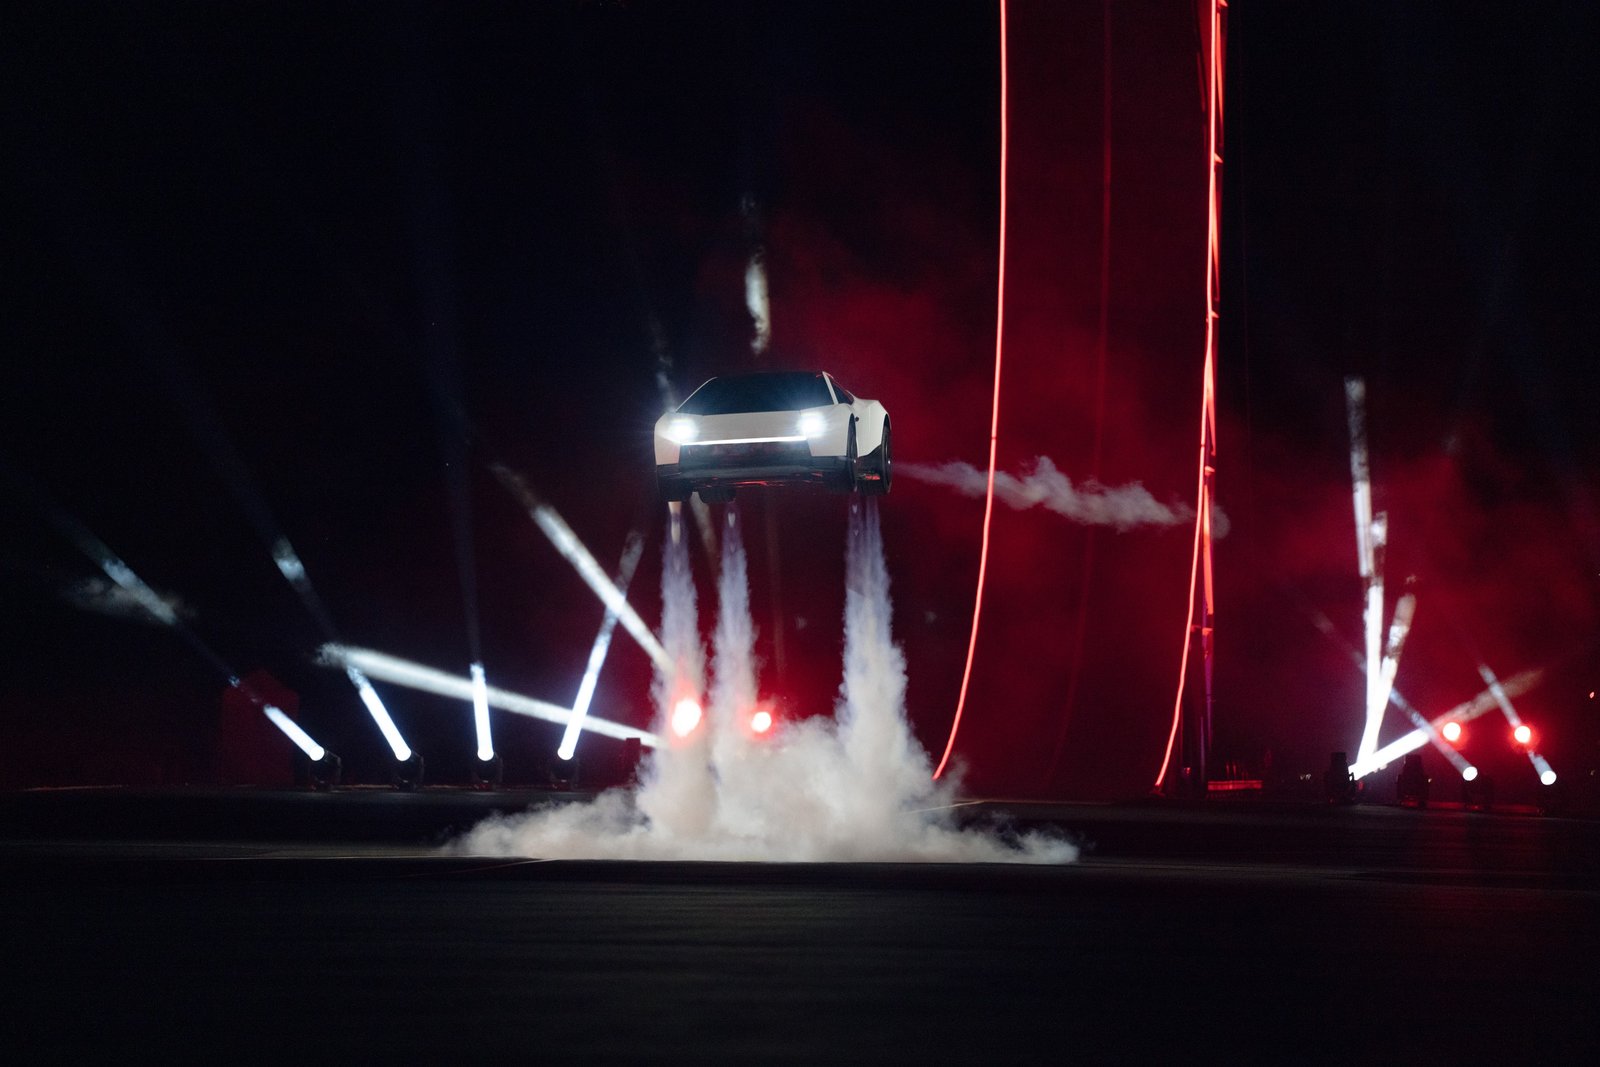
On October 15, Tesla unveiled the new Roadster at SpaceX’s test site in McGregor, Texas. It showed a prototype driving up a ramp and lifting into the air on compressed-air thrusters. The company said it reaches 60 mph (about 97 km/h) from a standstill in around one second, and the reservation deposit is $50,000. It did not say whether production cars will have the thrusters.
The stock did not keep pace with the car. On October 16, the day after the unveiling, it fell 2.1% to $354.72, and the close on the day of the earnings report ($386.47) was still 9.1% below the July 1 high ($425.30).
After October 16, though, it rose about 9% over the three trading days before the report. Another catalyst came on October 20, when Musk said at SpaceX’s earnings presentation that the two companies are considering a merger through a special committee of independent directors. No terms have been set, and Musk did not promise that a deal would happen.
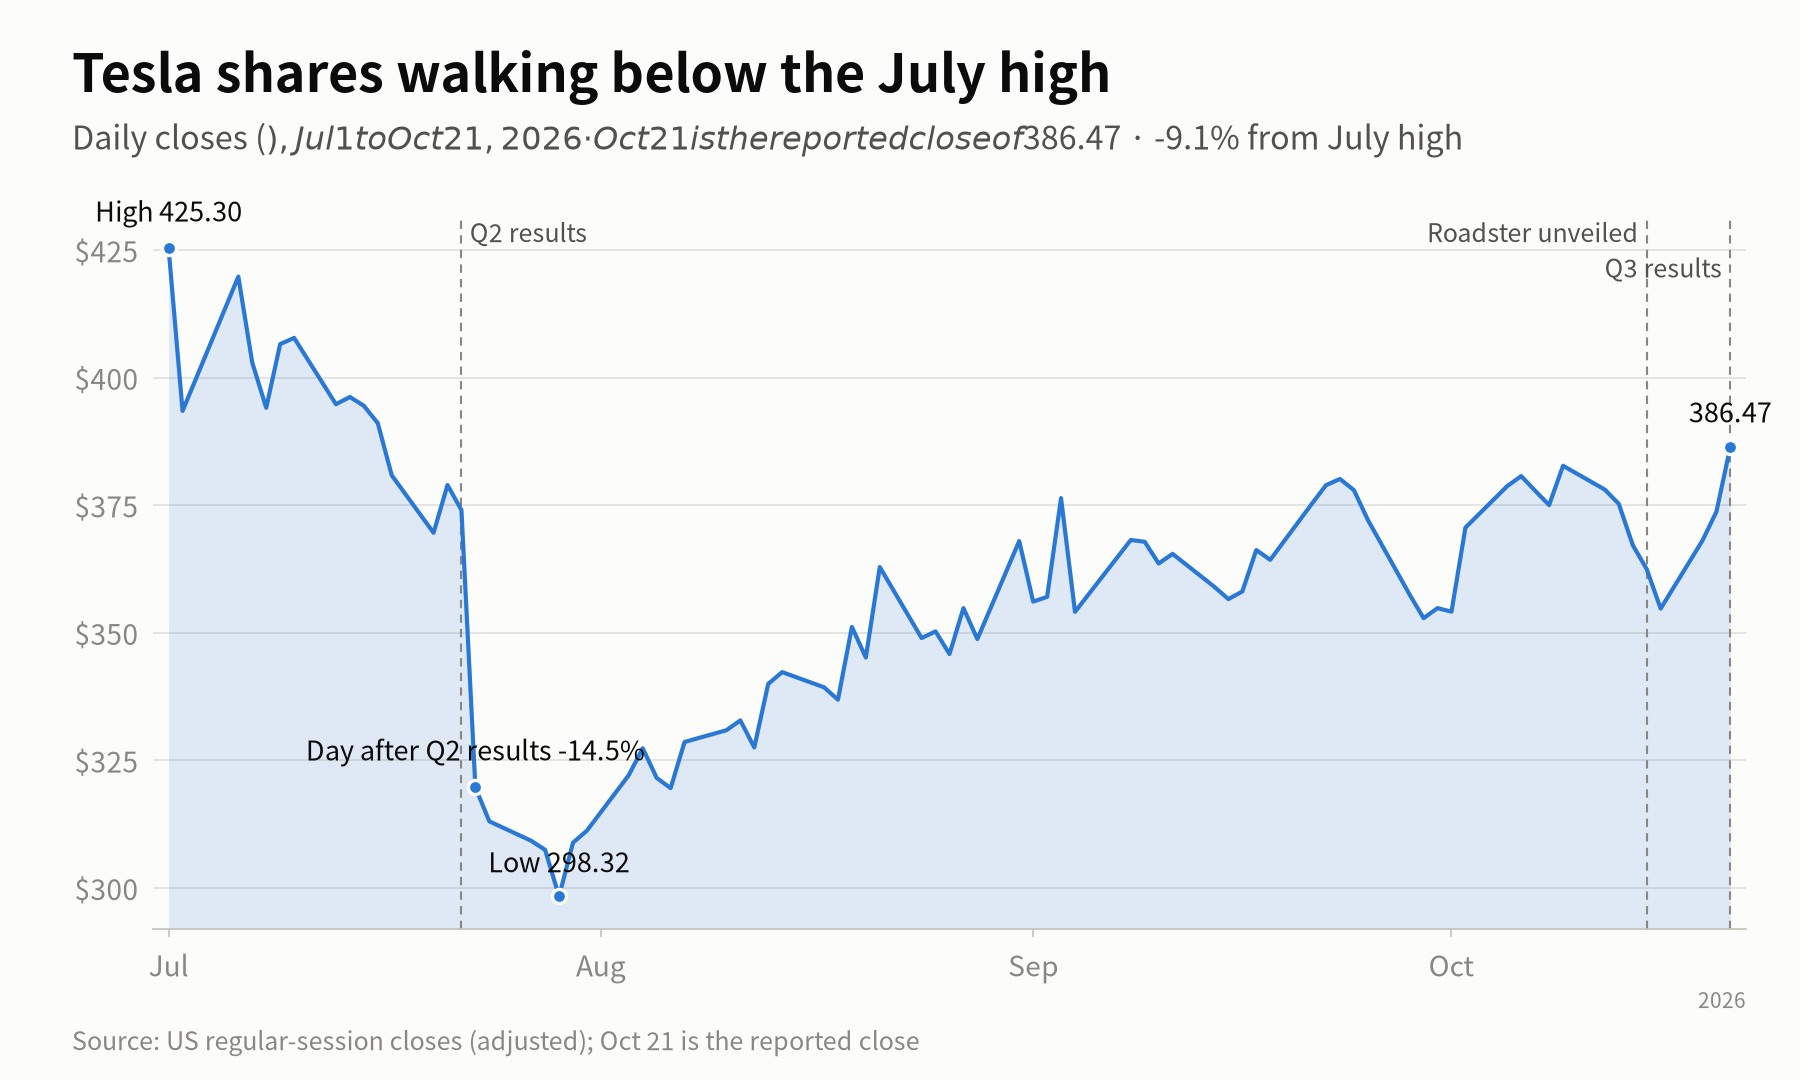
In after-hours trading following the report, the stock first rose, then dropped 2-3% once the conference call began. That was a small reaction compared with the 14.5% one-day drop the day after the Q2 results (July 23). Share prices in this post are based on the October 21 close, the last regular session before the report.
Three things to watch before the next report
24/7 Wall St. estimated that, at the October 15 price ($380.54), Tesla trades at about 159 times its expected earnings over the next year. That means expectations for its future businesses make up far more of the price than its current earnings.
- Whether the operating margin returns from the 2% range to the 5% range of a year ago
- Whether paid FSD users and the number of cities with robotaxi service grow
- Whether the SpaceX merger talks lead to actual terms
This post reflects information as of October 22, 2026, and is not investment advice on any particular stock or product. Do you see Tesla today as a car company or an AI company?
Frequently asked questions
Q1. Tesla’s operating income fell, so why did its gross margin rise?
A1. Gross margin is calculated after subtracting only the cost of the cars and batteries; operating income also subtracts R&D, sales and administrative costs, and stock-based compensation. In Q3, production costs weighed less, but R&D spending rose 69%, so operating income fell.
Q2. Why are Tesla’s net income and adjusted earnings per share different?
A2. Adjusted earnings per share ($0.48) is calculated excluding items such as stock-based compensation. Net income under accounting standards (GAAP) was $787 million, or $0.22 per share, down 43% from a year earlier. When reports give different figures, the difference usually comes down to which of these bases they use.
Q3. Will the 33% margin in Tesla’s energy business last?
A3. Energy gross margin jumped from 20.4% in Q2 to 33.1%, but it includes one-time items such as tariff refunds and supplier compensation. Deployments were 13.7 GWh, up 10% from a year earlier but short of the consensus (15.9 GWh).
Sources: Tesla Q3 2026 earnings release (2026-10-21); CNBC, Investing.com, SiliconANGLE (2026-10-21); Axios (2026-10-20); CNBC, Aviation Week (Roadster unveiling, 2026-10-15); 24/7 Wall St. (2026-10-15); US regular-session closes (share prices, adjusted; October 21 is the reported close). Lead photo: Tesla, Tesla press release
Information only, not investment advice.
Related reading
More in Blog
- NAND Outlook Up, Shares Down: Sandisk and Kioxia Report October 29-30
- Nasdaq Down Two Weeks: Can Google, Microsoft and Amazon Stop It?
- Record Quarter, 12% Drop: Why Lam Research Stock Fell
- SK hynix, Kioxia Slide: 3 Reasons Asia's Chip Stocks Fell Together
- Why Month-End Earnings Matter for NAND-Only Kioxia and Sandisk
- Shortage Until 2028 or NAND Glut? Samsung and SK hynix
- US Chip Stocks End an Eight-Day Slide, and Memory Came Back First
- How Much Can Korea's Pension Giant Move Samsung and SK hynix?
- Samsung Electronics and SK hynix Pulled the KOSPI Down 14%. Why?