Market Map
Japan chips on Oct 26: −2.69%
Japan’s chip stocks: 22 companies worth US$3 billion or more. Mostly what chipmakers buy - equipment (Tokyo Electron, Advantest, Disco, Lasertec, SCREEN, Kokusai Electric and others) and wafers and materials (Shin-Etsu Chemical, SUMCO, JX Advanced Metals, Tokyo Ohka Kogyo and others) - plus Kioxia in NAND memory and Renesas and Rohm in chips. Taken from Japanese semiconductor indexes, keeping companies whose main business is chips. Tokyo Stock Exchange closes in yen, sized in US dollars.
Biggest rises, Oct 26
- JX Advanced Metals−0.14%
- Nissan Chemical−0.23%
- Sumitomo Bakelite−0.72%
- Shin-Etsu Chemical−0.74%
- Taiyo Holdings−0.89%
Biggest falls, Oct 26
- Rorze−5.93%
- Tokyo Seimitsu−4.48%
- SCREEN Holdings−4.34%
- Kokusai Electric−4.29%
- Micronics Japan−3.93%
How to read this map
- Size
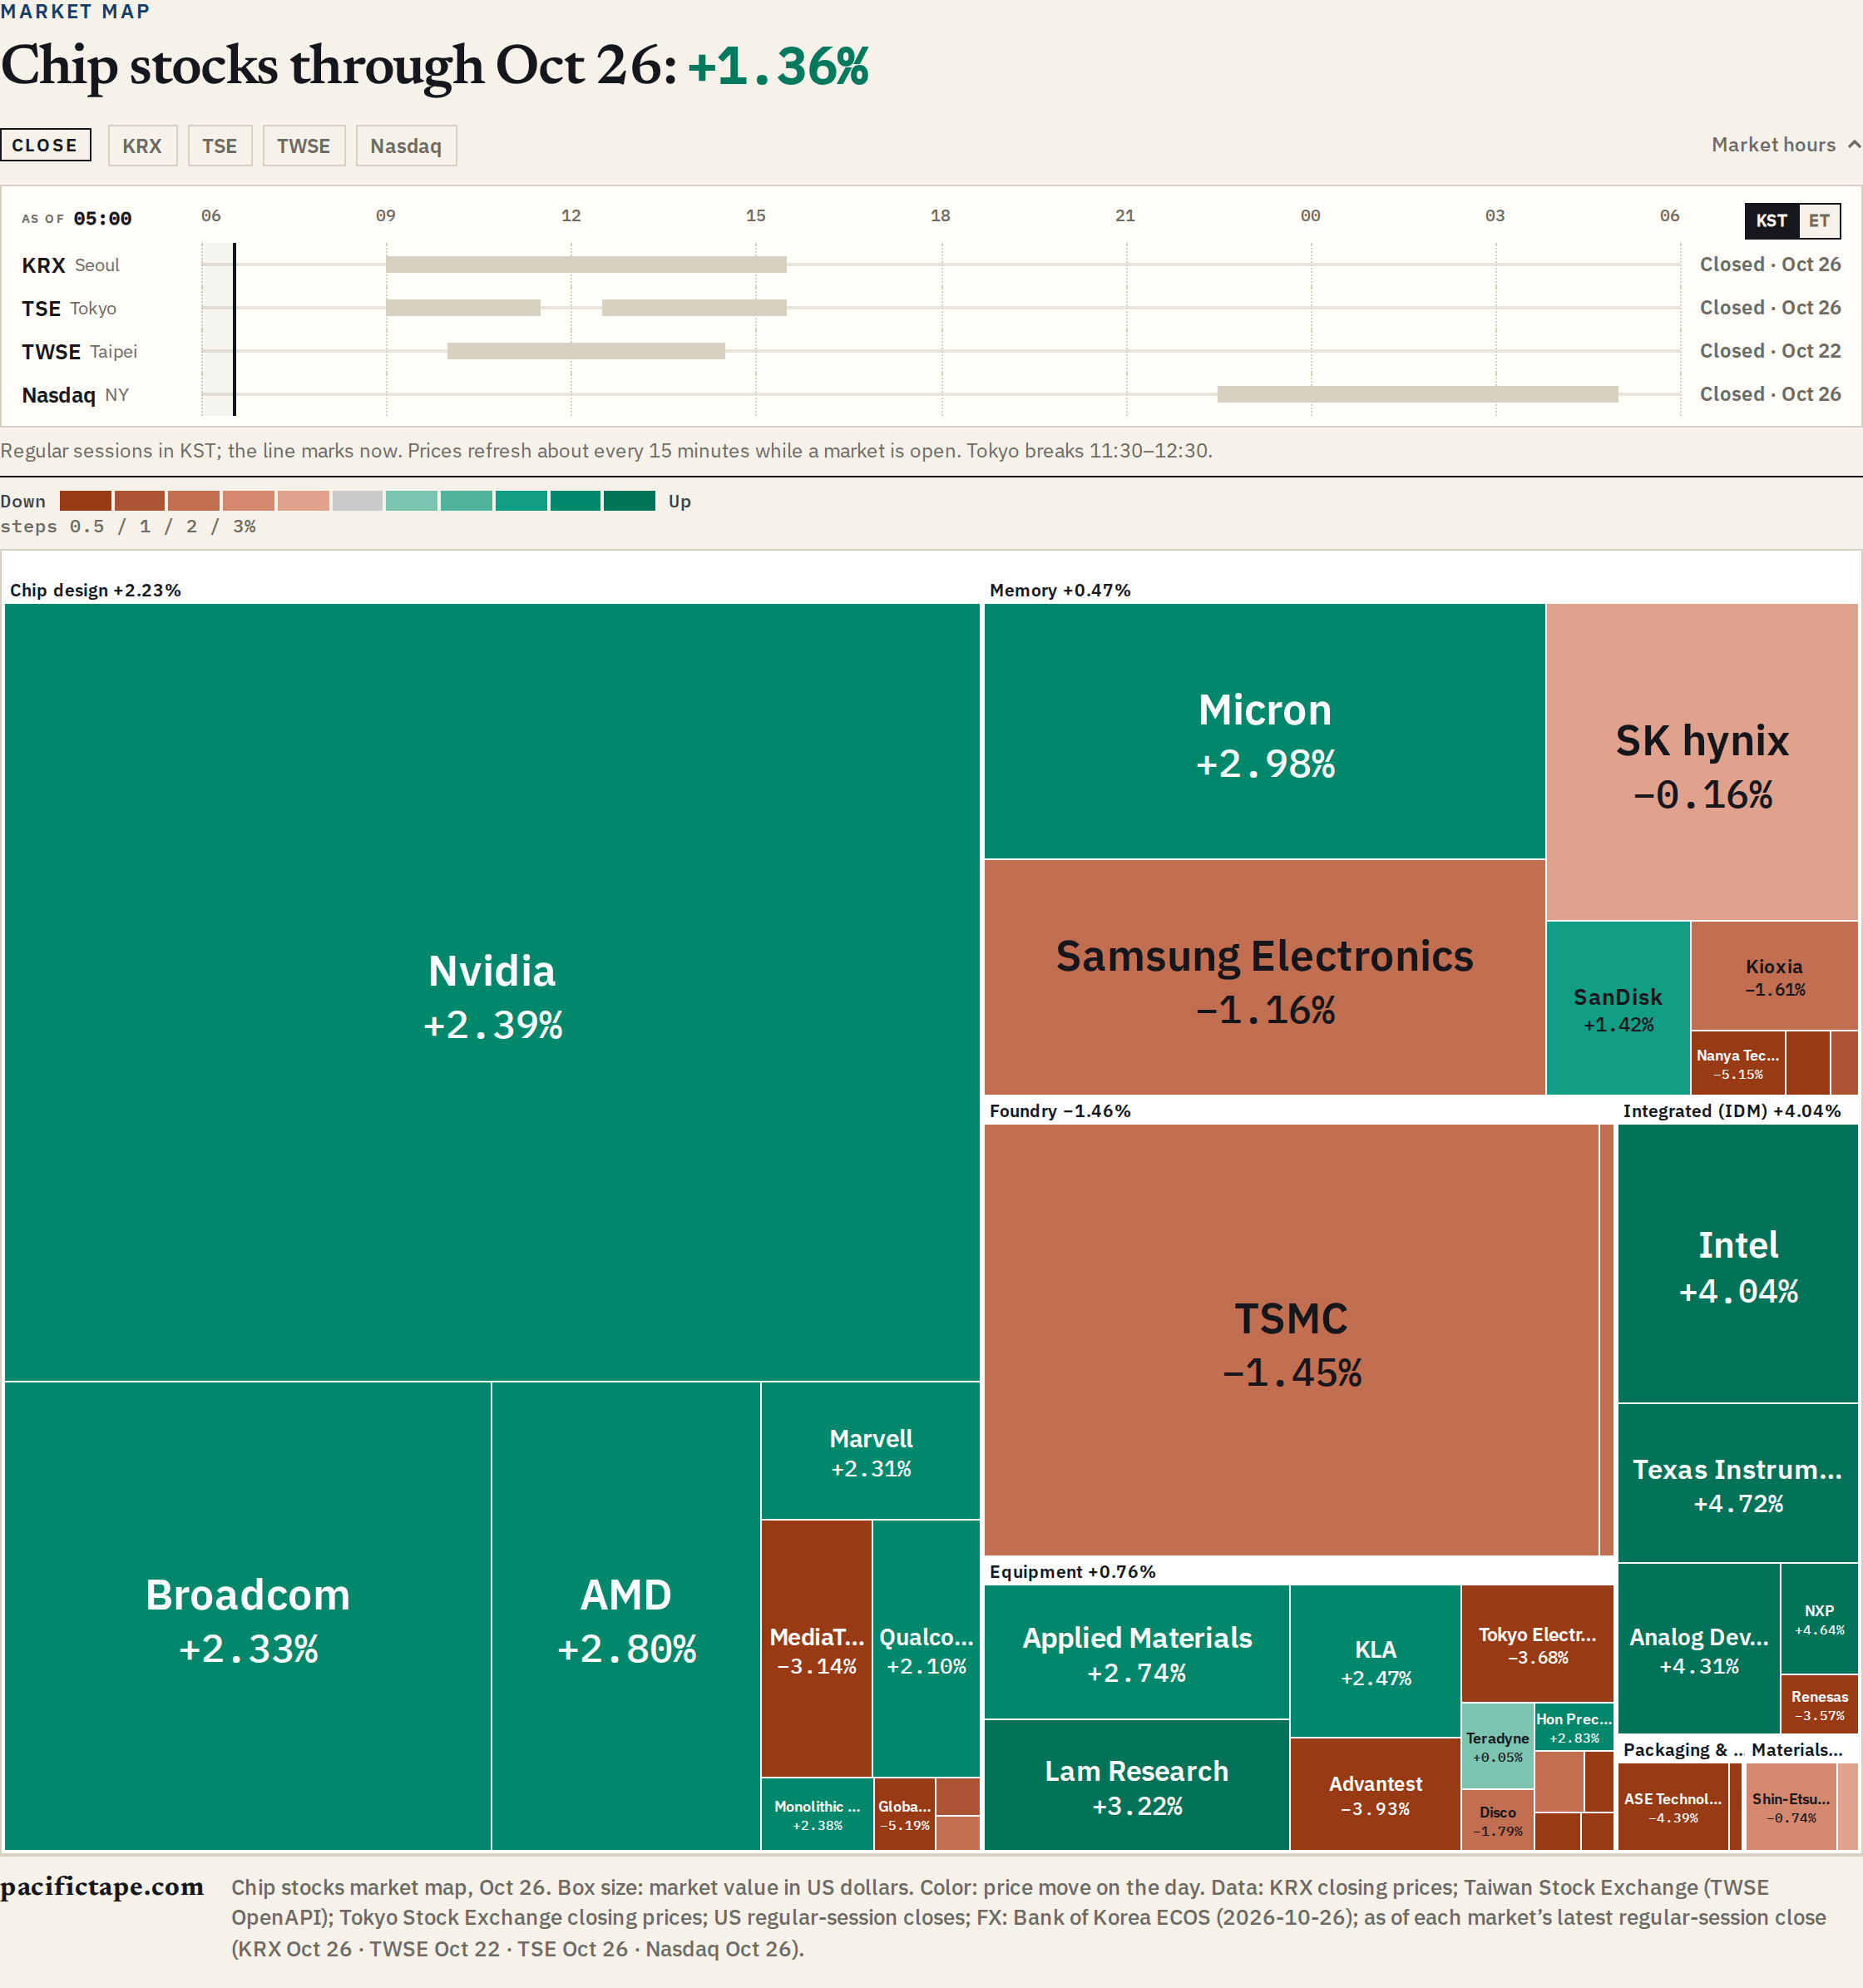
- Market value at each market’s latest close, or at the latest update while that market is open. On the semiconductor maps you can also size boxes by the square root of market value, or compare only within a group.
- Color
- The move over the period you pick: green up, red down, gray flat. Every number carries + or −.
- Updates
- About every 15 minutes while a market is open (Japan and Taiwan 20 minutes delayed); each market keeps its closing prices after it closes.
- Data
- KRX closing-auction prices (adjusted) and Korea Exchange statistics (한국거래소 통계정보) via KRX Open API (earlier closes); Taiwan Stock Exchange (TWSE OpenAPI); Tokyo Stock Exchange closing prices; US regular-session closes (S&P 500, Nasdaq-100, Dow Jones Industrial Average and PHLX Semiconductor Sector Index members, GICS sectors, shares outstanding from SEC filings); FX: Bank of Korea ECOS. Summary above as of 2026-10-26 close.
More to readAll articles →
Method
Boxes are grouped by role in the chip supply chain (or by country) and sized by market value in US dollars at each market’s latest close. Moves use each market’s regular-session closing prices, adjusted for splits; a 20-day move counts 20 sessions of that market, so the dates differ a little between countries. While a market is open its boxes show the latest trades (Japan and Taiwan 20 minutes delayed), updated about every 15 minutes; a closed market keeps its closing prices. Members are picked by rule from the constituents of global and regional semiconductor indexes: China and Hong Kong listings and non-chip businesses are left out, and a market value of at least US$10bn (US$50bn for US stocks) is needed on the Chips map.
The size-weighted move weights each stock by its market value at the start of the period, so it is the return of holding every box on the map in proportion to its size.
A map shows what moved, not why. Nothing here is a recommendation to buy or sell.
Market map notes
- Chip Stock Heatmap Explained: How to Read the Asia-Pacific Chips Map
How to read Pacific Tape's chip stock heatmap: 41 chipmakers from Korea, Taiwan, Japan and the US, box sizes, colors, groups, periods, using October 20, 2026.
Pictures first, short explanations after. Nothing here is a recommendation to buy or sell.